
OpenObserve Plugin for Grafana
This guide walks you through installing and configuring the openobserve plugin in Grafana within a Kubernetes environment. If you are not using Kubernetes, you can adapt these steps for your environment.
Overview
Grafana is an open-source platform for creating dashboards and visualizations. OpenObserve provides its own interface for logs, metrics, tracing, frontend monitoring, dashboards, and alerting and notifications.
The OpenObserve plugin for Grafana is an optional integration. It enables OpenObserve to be added as a Grafana data source, making it possible to use existing Grafana dashboards or combine OpenObserve data with other monitoring systems.
Plugin maintenance status
OpenObserve actively maintains this Grafana plugin.
Quick start
If you are familiar with the Grafana plugin installation process, proceed to download the plugin and skip ahead to using the plugin in Grafana.
Install the OpenObserve plugin in Grafana
Prerequisite
Storage Requirements
Grafana requires persistent storage for two things: configuration and data.
- Configuration can be stored in a ConfigMap or Secret.
- Data must be stored in a database. Grafana supports SQLite, MySQL, and PostgreSQL. Most Grafana installations run on a single node with SQLite.
Deployment method
In Kubernetes, you deploy applications using either a Deployment or StatefulSet. Since Grafana needs persistent storage for its data, your choice depends on which database you use:
- SQLite stores data files inside the pod itself. Use a
StatefulSetto preserve this data when the pod restarts. - MySQL or PostgreSQL store data in an external database. Use a
Deploymentsince the data persists outside the pod.
Note
This guide uses a StatefulSet with SQLite.
Step 1: Create the configuration file
Create a grafana.ini file with the following configurations.
[date_formats]
default_timezone = UTC
[server]
root_url = https://grafana.yourdomain.com

[plugins]
enable_alpha = true
app_tls_skip_verify_insecure = false
allow_loading_unsigned_plugins = openobserveImportant:
- In
Line 4, you must update theroot_urlwith the root URL of your Grafana installation. This is the URL that you will use to access grafana. For example,https://grafana.yourdomain.com. - In
Line 9, you must specify that Grafana should use the unsigned pluginopenobserve.You will install this plugin using theinit containerin thestatefulset.
Step 2: Create a Kubernetes secret
Once you have created the file, you can create a Kubernetes secret using the below command.
kubectl create secret generic grafana-config --from-file=grafana.iniThis secret is mounted into the Grafana container in the following StatefulSet YAML.
Step 3: Create grafana_statefulset.yaml
This file includes an init container that downloads and configures the openobserve plugin for the Grafana container.
apiVersion: apps/v1
kind: StatefulSet
metadata:
  name: grafana
spec:
  serviceName: "grafana"
  replicas: 1
  selector:
    matchLabels:
      app: grafana
  template:
    metadata:
      labels:
        app: grafana
    spec:
      securityContext:
        fsGroup: 2000
        runAsUser: 10000
        runAsGroup: 3000
      initContainers:
        - name: openobserve-plugin-loader
          image: wbitt/network-multitool
          imagePullPolicy: IfNotPresent
          command:
            [
              "sh",
              "-c",
              "curl -o /var/lib/grafana/plugins/zo_gp.tar.gz https://zincsearch-releases.s3.us-west-2.amazonaws.com/zo_gp/zo_gp.tar.gz && cd /var/lib/grafana/plugins &&  tar -zxvf zo_gp.tar.gz",
            ]
          volumeMounts:
            - name: grafana-base
              mountPath: /var/lib/grafana
            - name: grafana-plugins
              mountPath: /var/lib/grafana/plugins
      containers:
        - name: grafana
          image: grafana/grafana:latest
          ports:
            - containerPort: 3000
              name: grafana
          volumeMounts:
            - name: grafana-base
              mountPath: /var/lib/grafana
            - name: grafana-plugins
              mountPath: /var/lib/grafana/plugins
            - name: grafana-config
              mountPath: /etc/grafana
      volumes:
        - name: grafana-base
          persistentVolumeClaim:
            claimName: grafana-base
        - name: grafana-plugins
          persistentVolumeClaim:
            claimName: grafana-plugins
        - name: grafana-config
          secret:
            defaultMode: 420
            secretName: grafana-config
  volumeClaimTemplates:
    - metadata:
        name: grafana-base
      spec:
        accessModes: ["ReadWriteOnce"]
        resources:
          requests:
            storage: 1Gi
    - metadata:
        name: grafana-plugins
      spec:
        accessModes: ["ReadWriteOnce"]
        resources:
          requests:
            storage: 1Gi
---
apiVersion: v1
kind: Service
metadata:
  name: grafana
spec:
  ports:
    - port: 3000
      targetPort: 3000
  selector:
    app: grafana
Step 4: Deploy the openobserve plugin
Run the following kubectl apply command to deploy the plugin:
kubectl apply -f grafana_statefulset.yamlUse the OpenObserve plugin in Grafana
Step 1: Set up data source
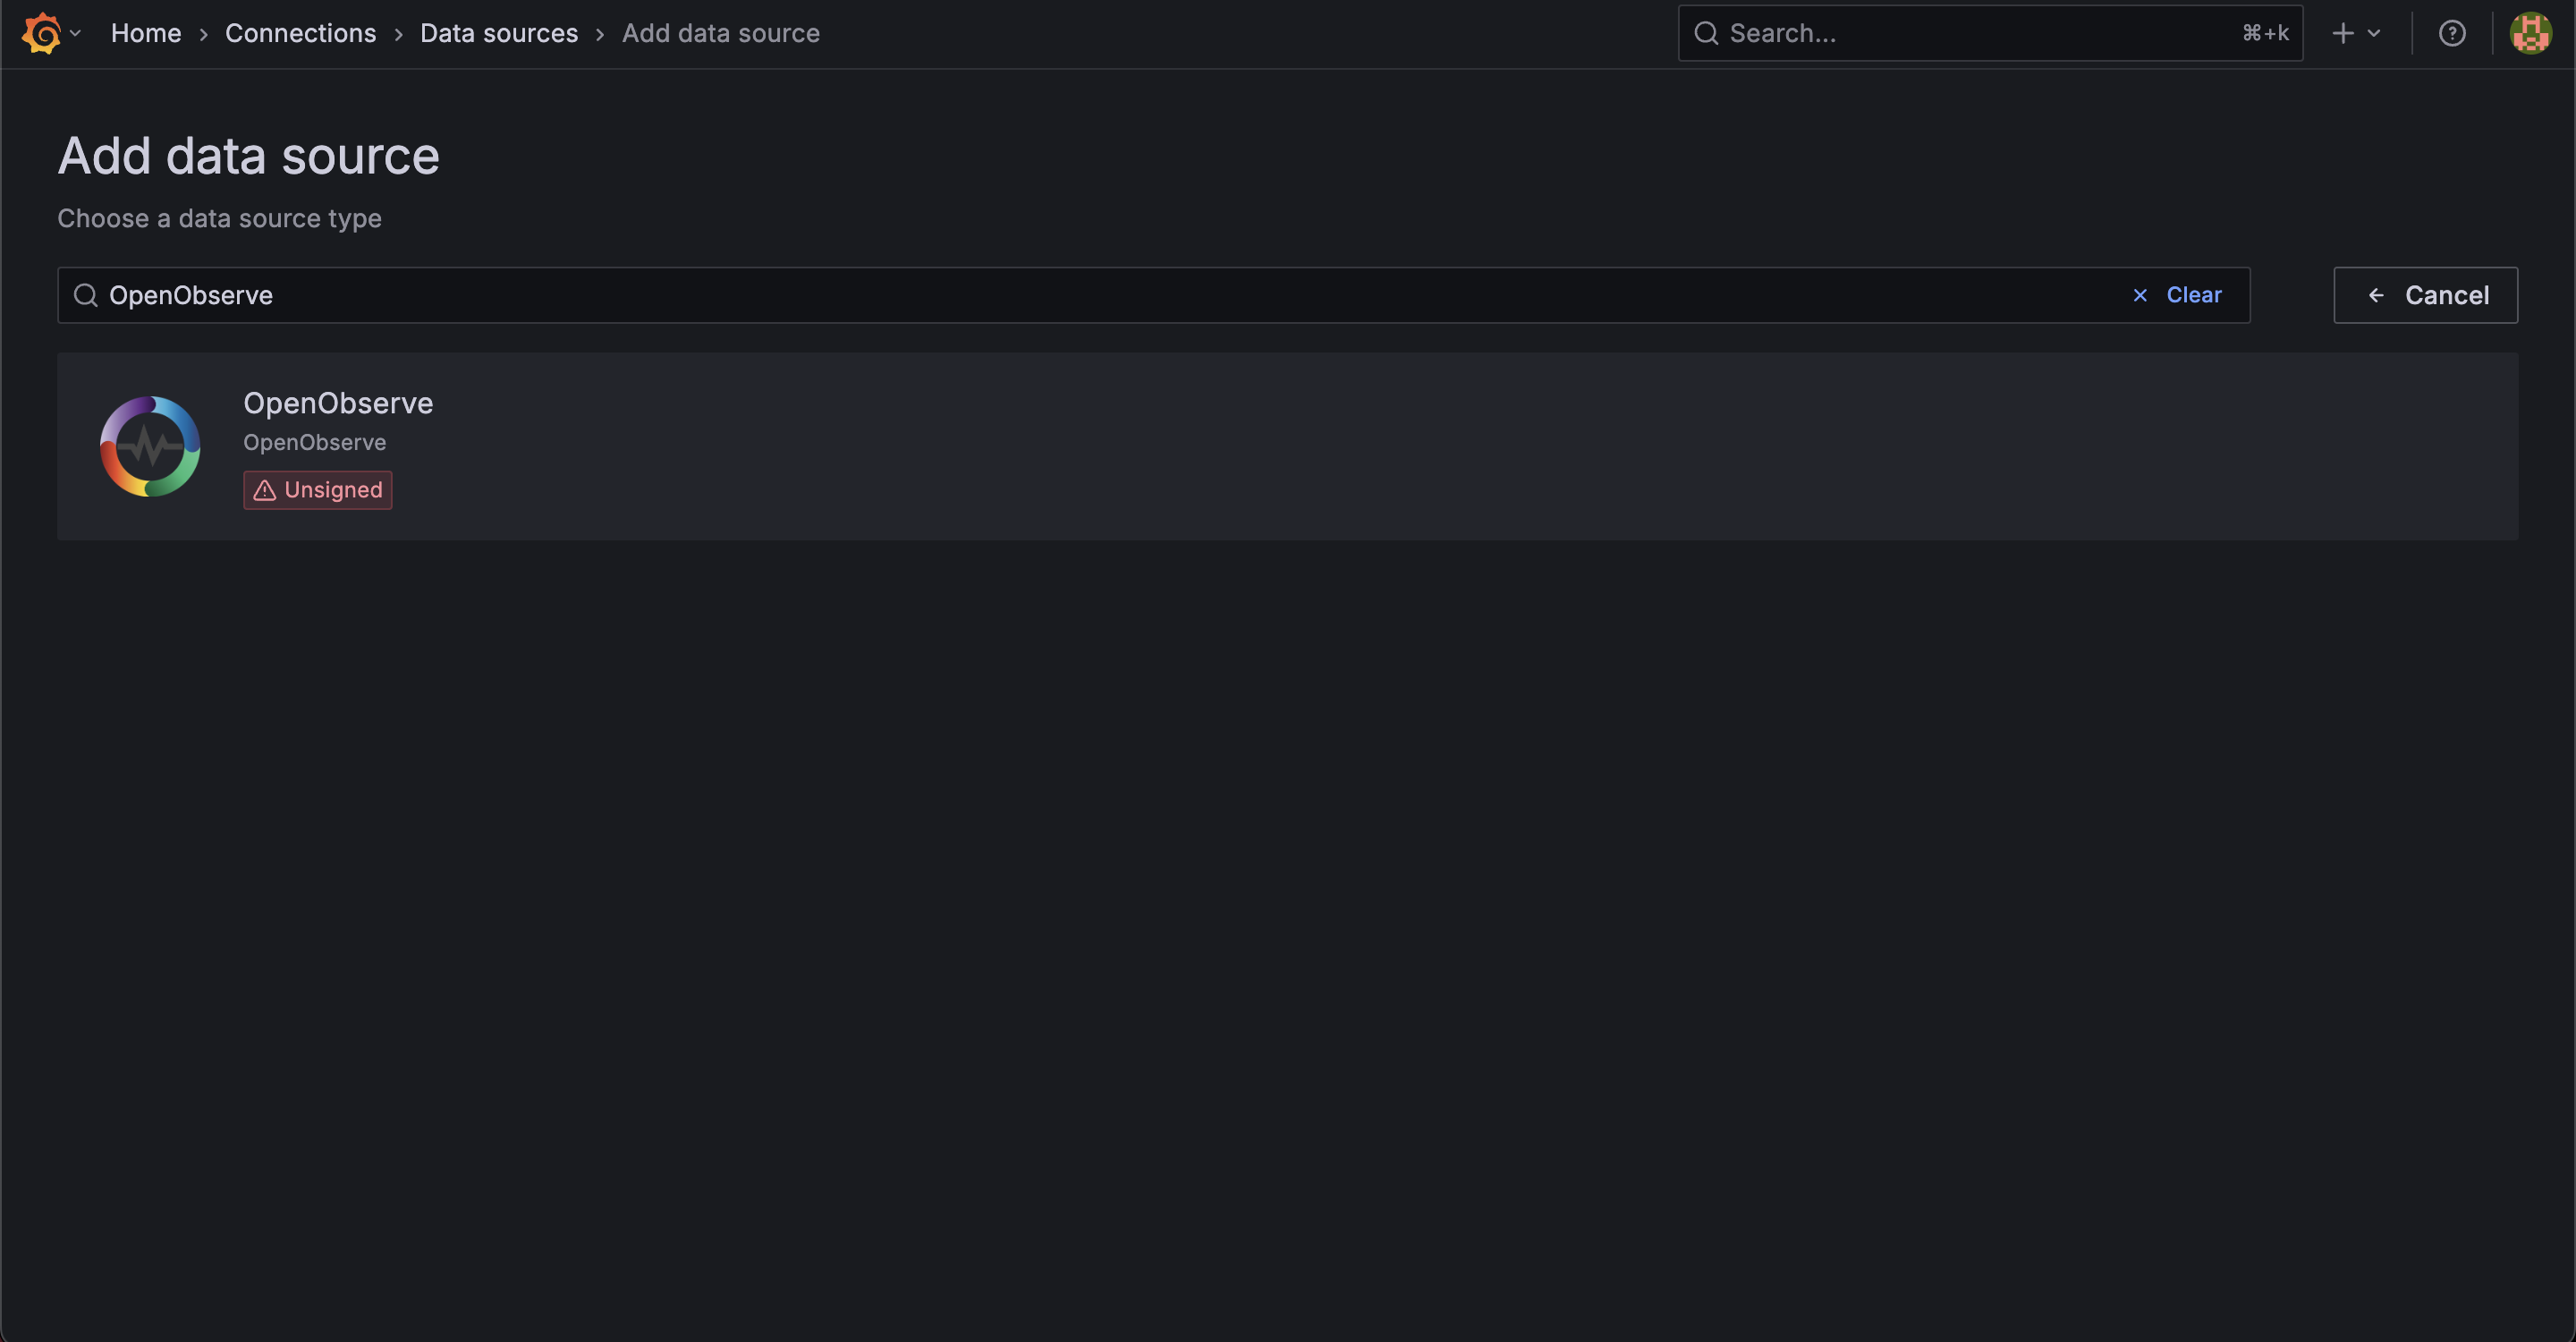
From the Grafana interface, go to the Data Sources section and search for openobserve.
Step 2: Add OpenObserve data source server details
-
In the data source configuration screen, update the following fields:
- In the HTTP section, add the URL.
- In the Auth section, enable Basic Auth toggle.
- Under Basic Auth Details, add the User ID and password.
-
Click Save and Test to save the changes.
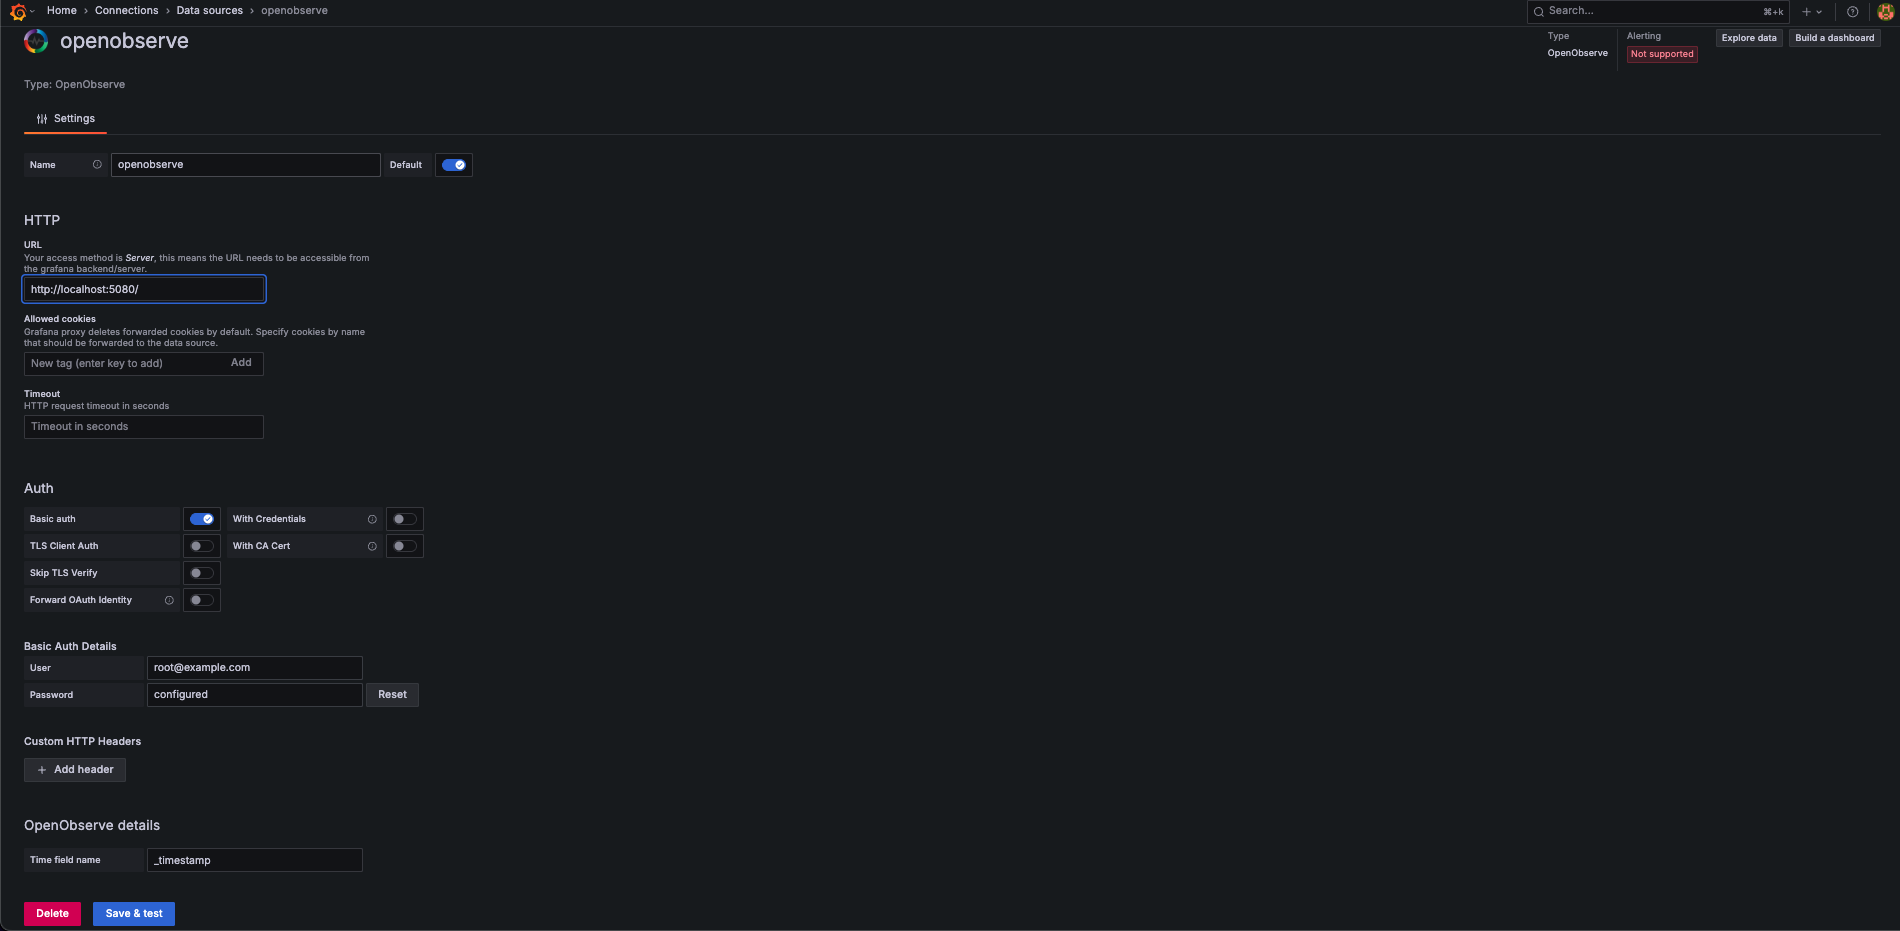 If everything is correct you should see a success message.
Step 3: Explore logs
- Click the Explore menu and select
openobserveas the data source. - Select appropriate organization, stream, and time range.
- Click Run Query.
You should now be able to see the results.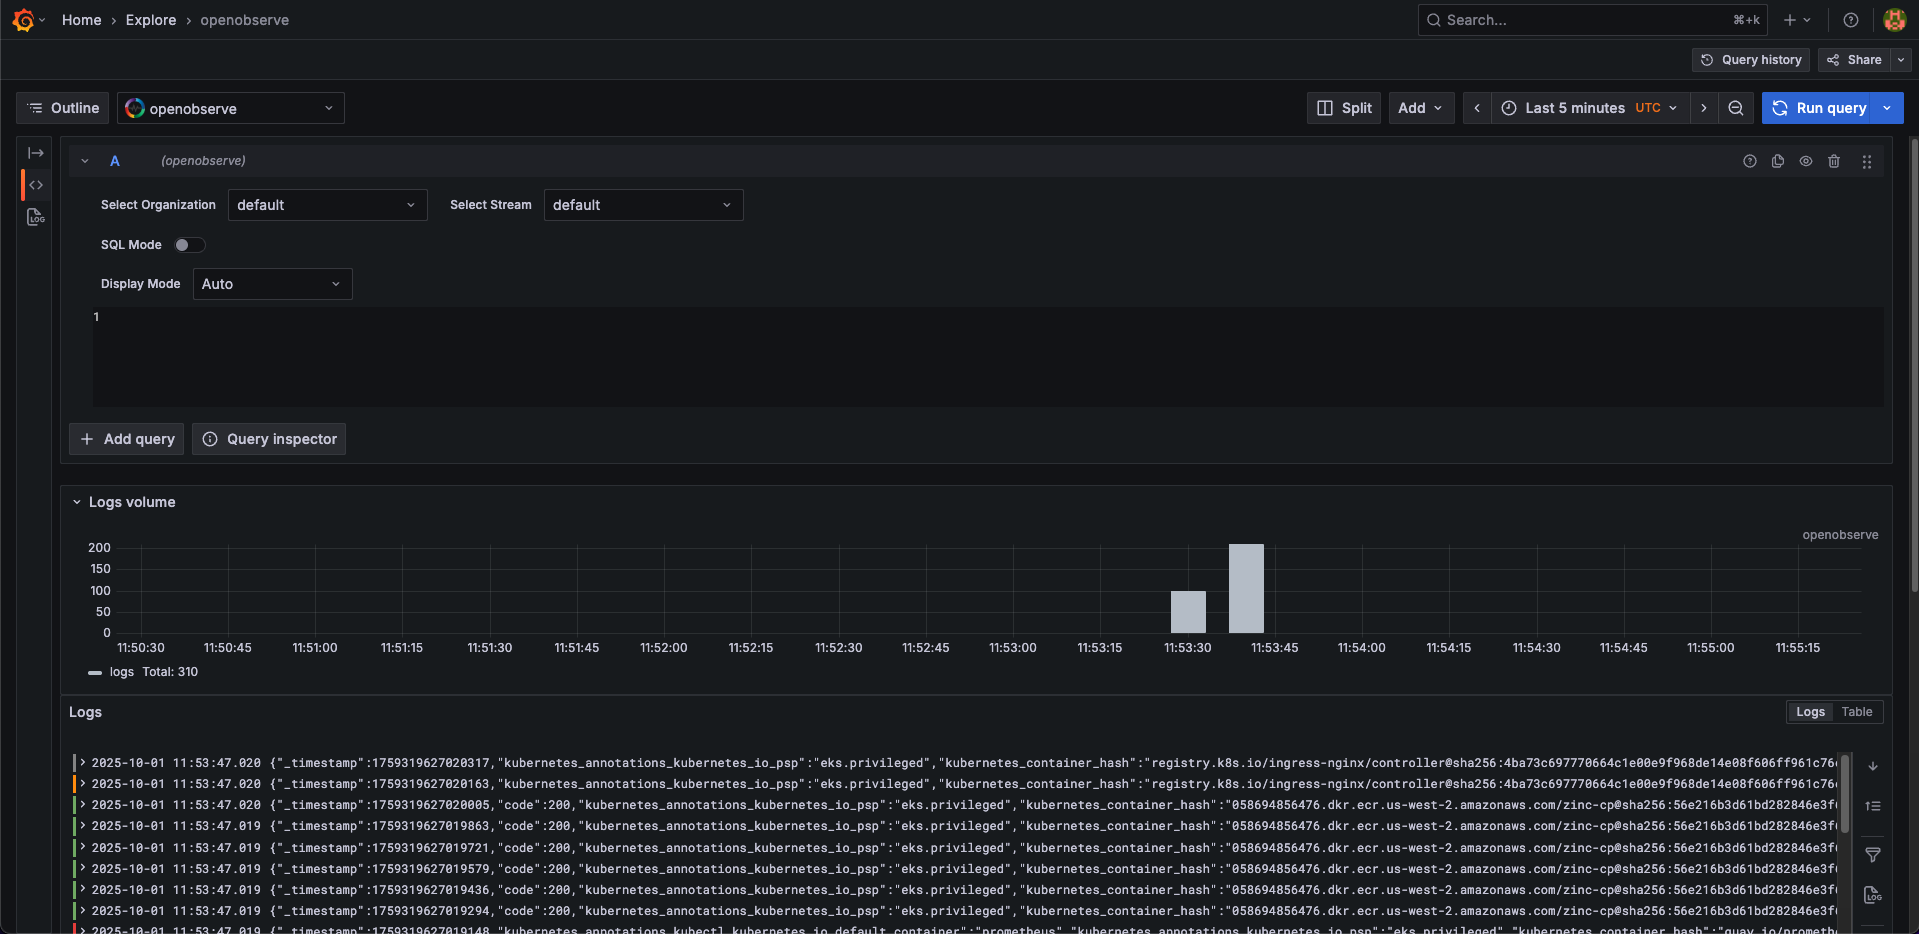
Note
If you want to explore metrics from OpenObserve in Grafana, you can set up OpenObserve as a Prometheus-compatible data source using an endpoint like https://api.openobserve.ai/api/org_name/prometheus. You do not need the plugin for this, as Grafana supports Prometheus natively.
Last updated on
Mimalloc
Enable Mimalloc in OpenObserve for optimized Rust memory management. Use cargo flags and env vars for fine-tuned performance and memory control.
Etcd maintenance
Learn how to maintain your etcd cluster with compaction, defragmentation, and space quotas to prevent data loss and ensure reliable performance.