
Python Distributed Tracing - OpenTelemetry APM
Setup distributed tracing for your Python application using OpenTelemetry for Python application performance monitoring (APM) and trace ingestion. Check sample configuration on how to setup OpenTelemetry traces for Python applications.
##Clone
git clone https://github.com/openobserve/sample-tracing-python
If you don't have Python3 installed, please install it and then follow below steps.
Open tracing.py file from that repository. and make changes to the highlighted lines below
from opentelemetry import trace
from opentelemetry.sdk.trace import TracerProvider
from opentelemetry.sdk.resources import SERVICE_NAME, Resource
from opentelemetry.sdk.trace.export import BatchSpanProcessor
from opentelemetry.exporter.otlp.proto.http.trace_exporter import OTLPSpanExporter


# Service name is required for most backends
resource = Resource(attributes={
    SERVICE_NAME: "python-service"
})

# create a tracer provider
tracer_provider = TracerProvider(resource=resource)

# create an OTLP trace exporter
url = 'HTTP_Endpoint'
headers = {"Authorization": "Authorization"}

exporter = OTLPSpanExporter(endpoint=url, headers=headers)

# create a span processor to send spans to the exporter
span_processor = BatchSpanProcessor(exporter)

# add the span processor to the tracer provider
tracer_provider.add_span_processor(span_processor)

# set the tracer provider as the global provider
trace.set_tracer_provider(tracer_provider)
##Setup up credentials
You will get url and Authorization key from the OpenTelemetry ingestion settings.
Replace the url and Authorization key in the tracing.py file.
##Setup Service/Application Follow the steps given in the sample-tracing-python readme and then start server
python3 app.pyThe server is now running, navigate to http://127.0.0.1
Refresh page couple of times to get more traces exported.

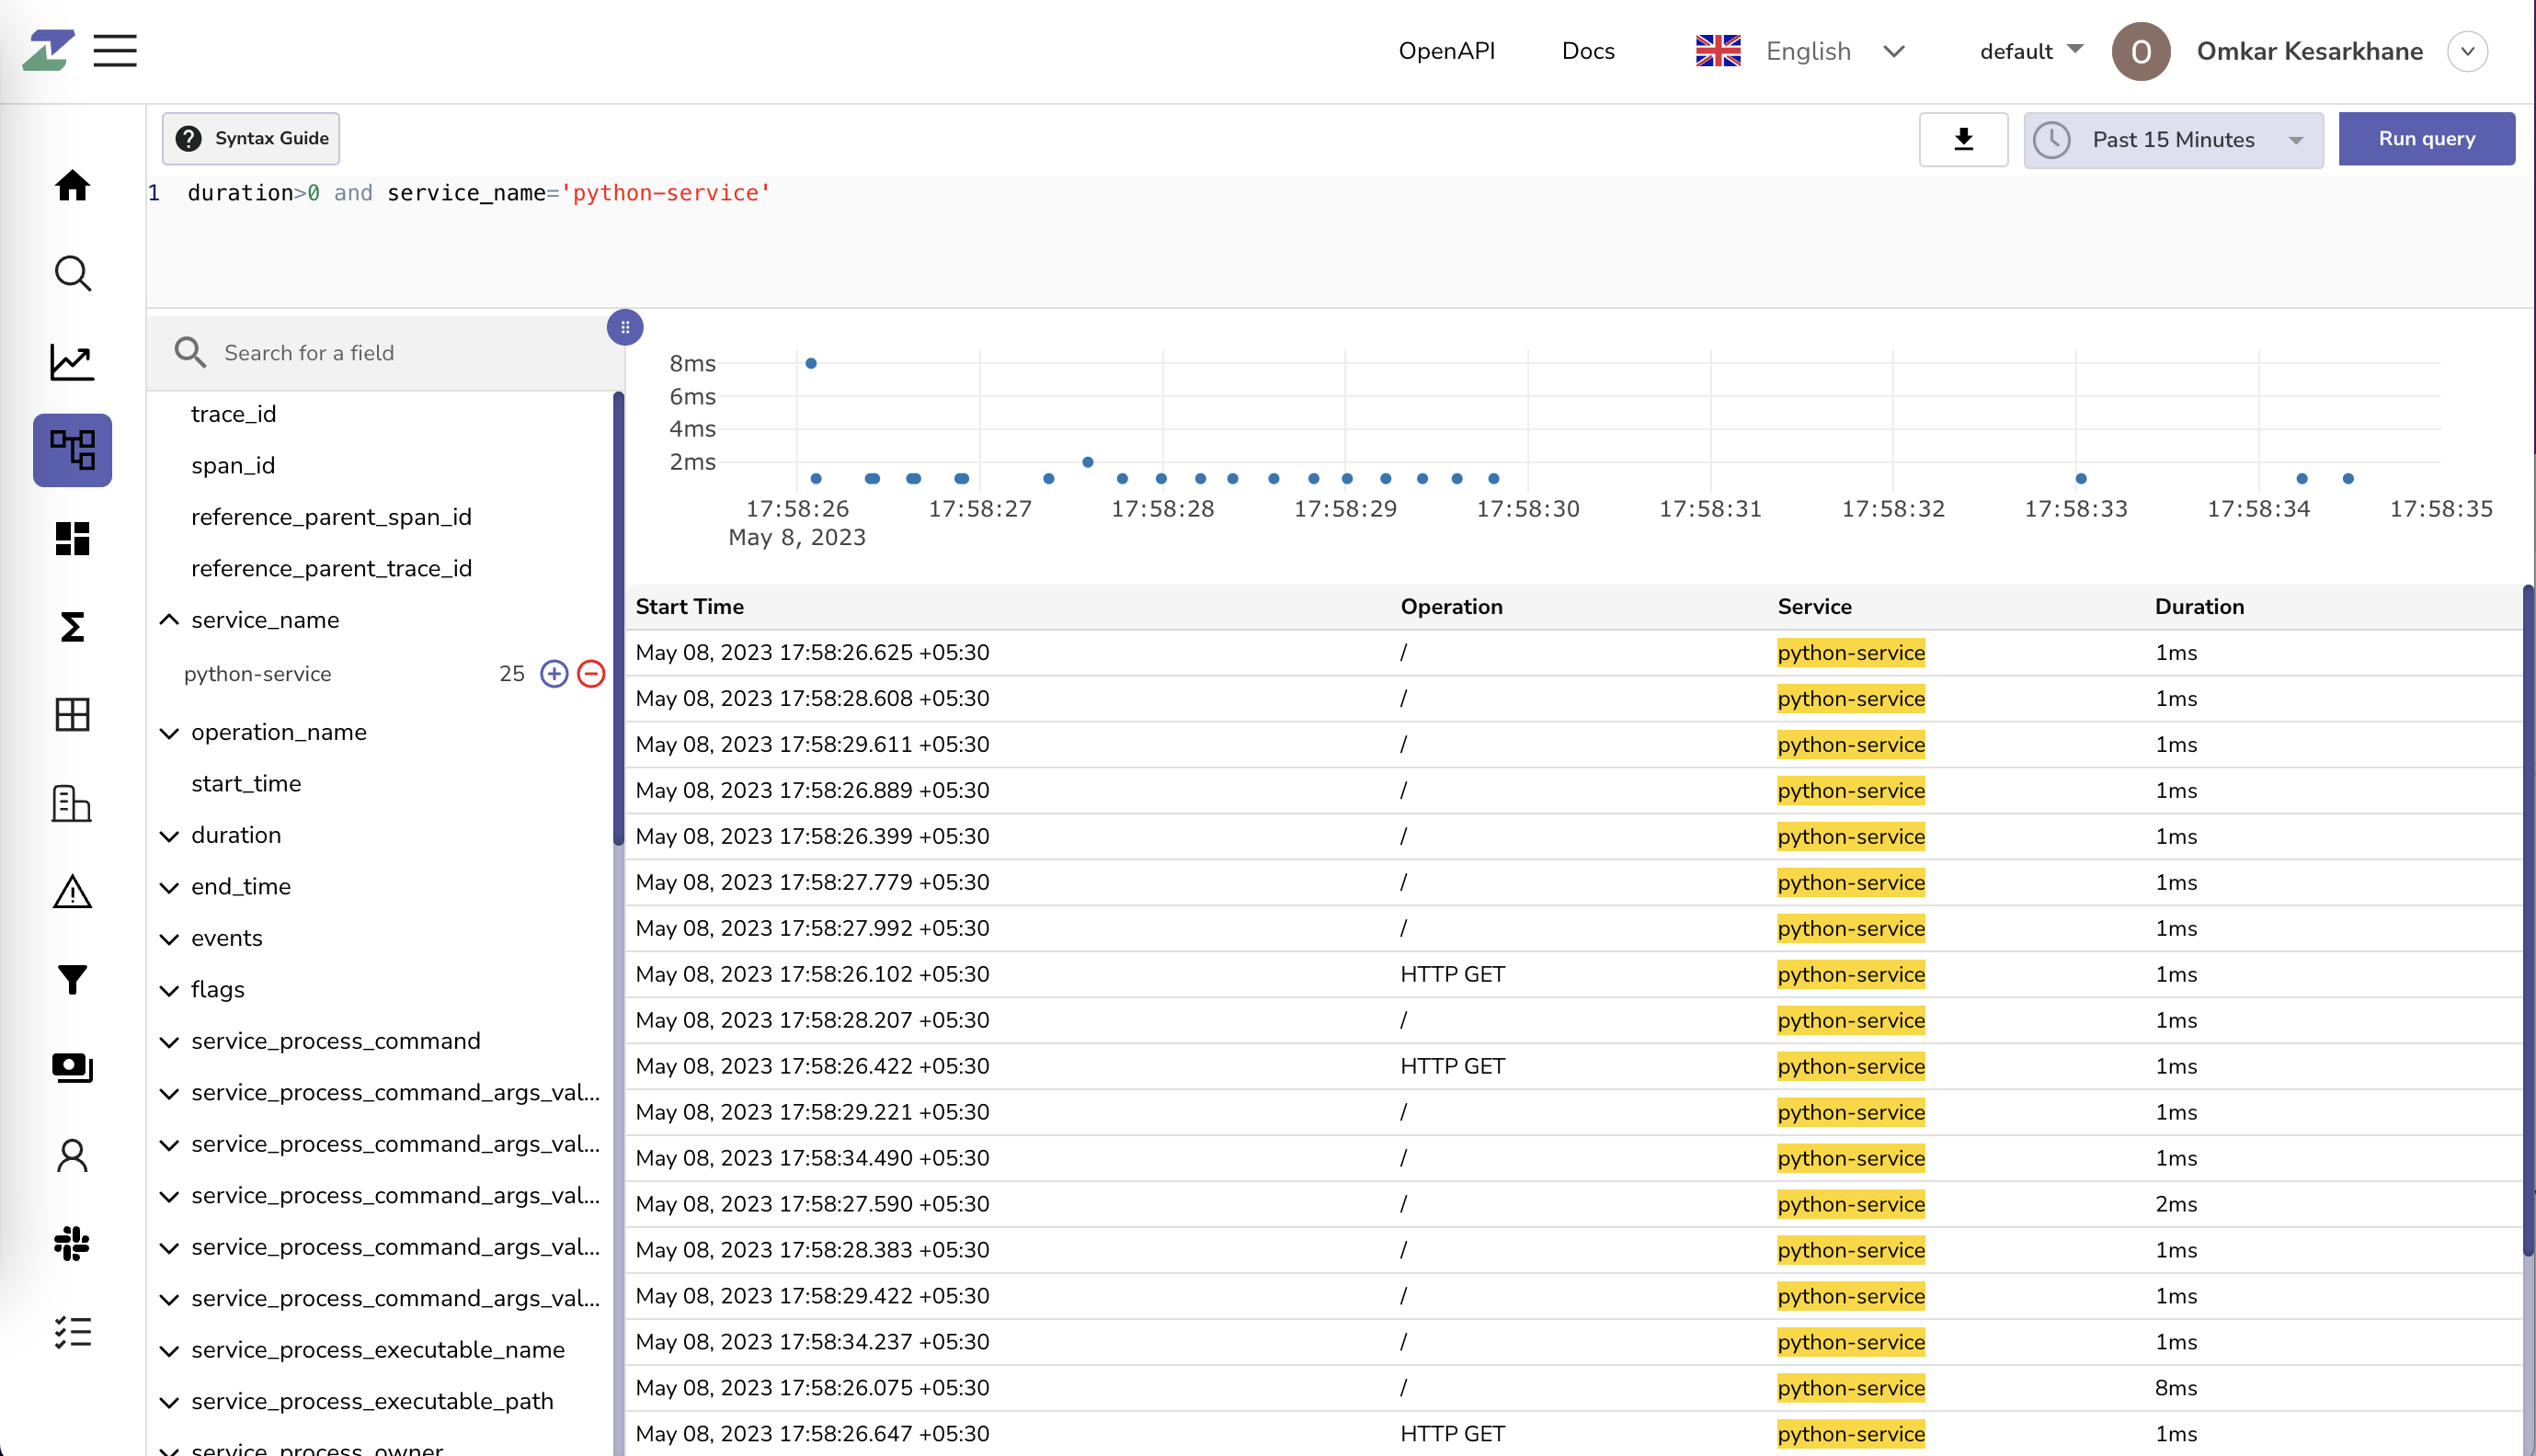
Traces are captured, you can check these captured traces here https://cloud.openobserve.ai/web/traces.
Filter traces with your service name python-service
Click on any trace to check trace data
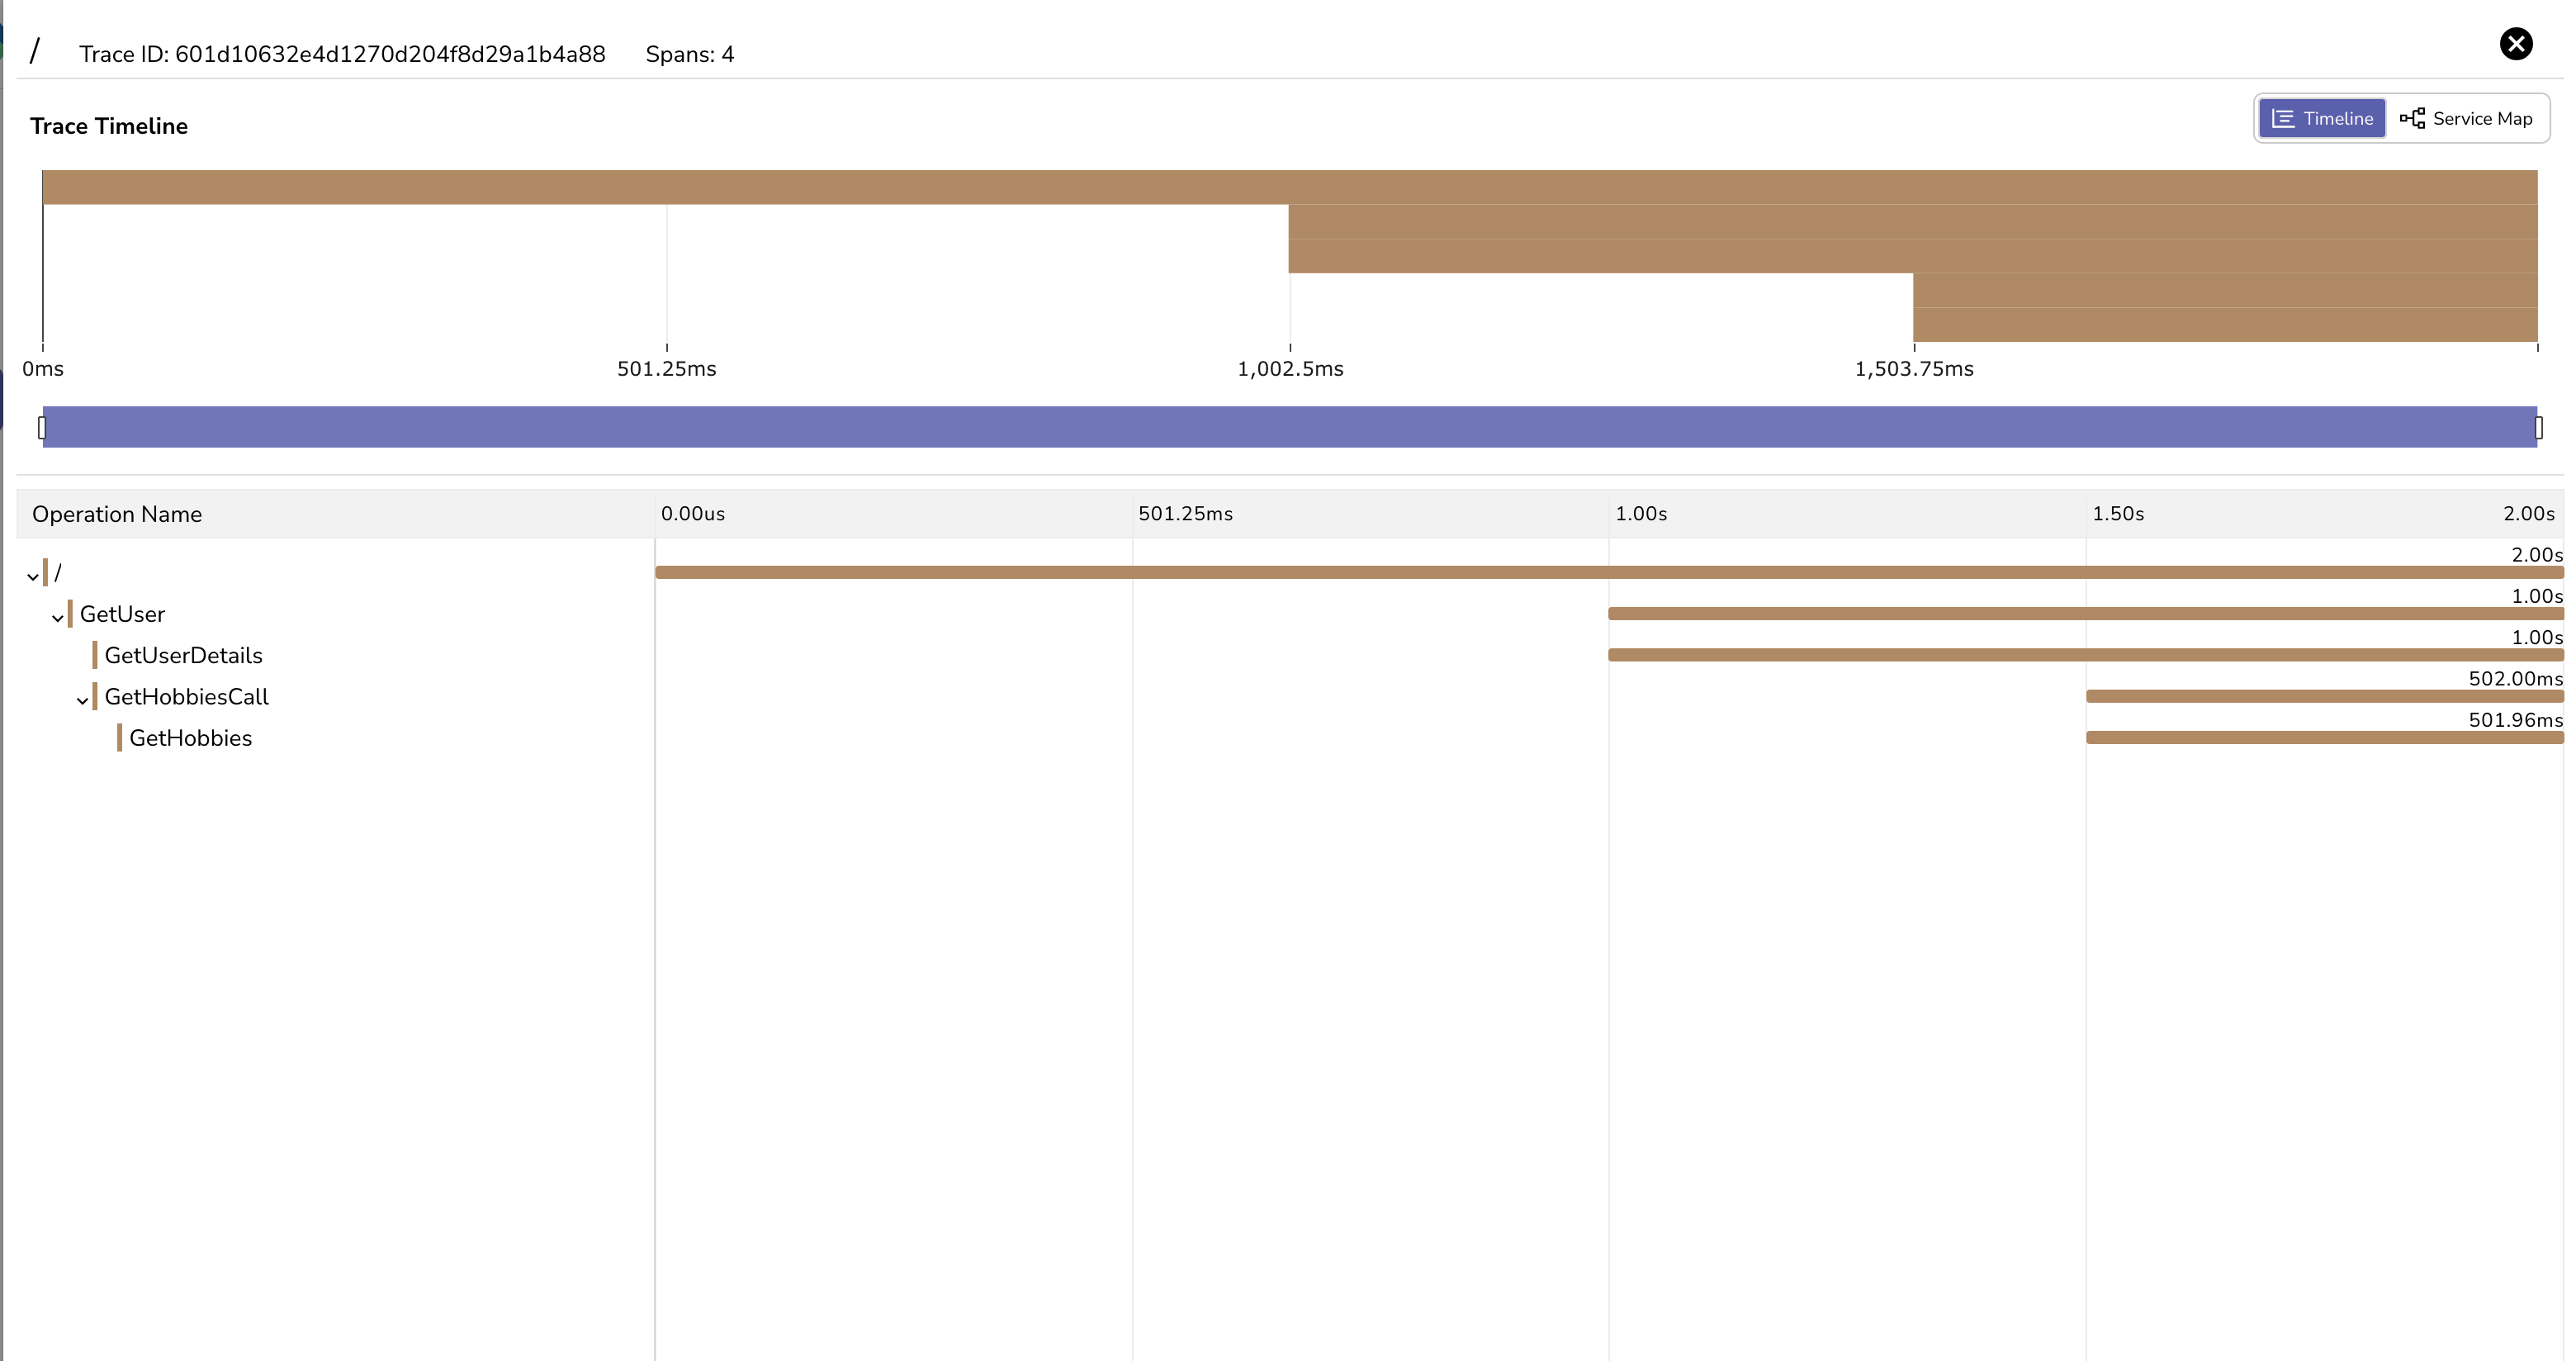
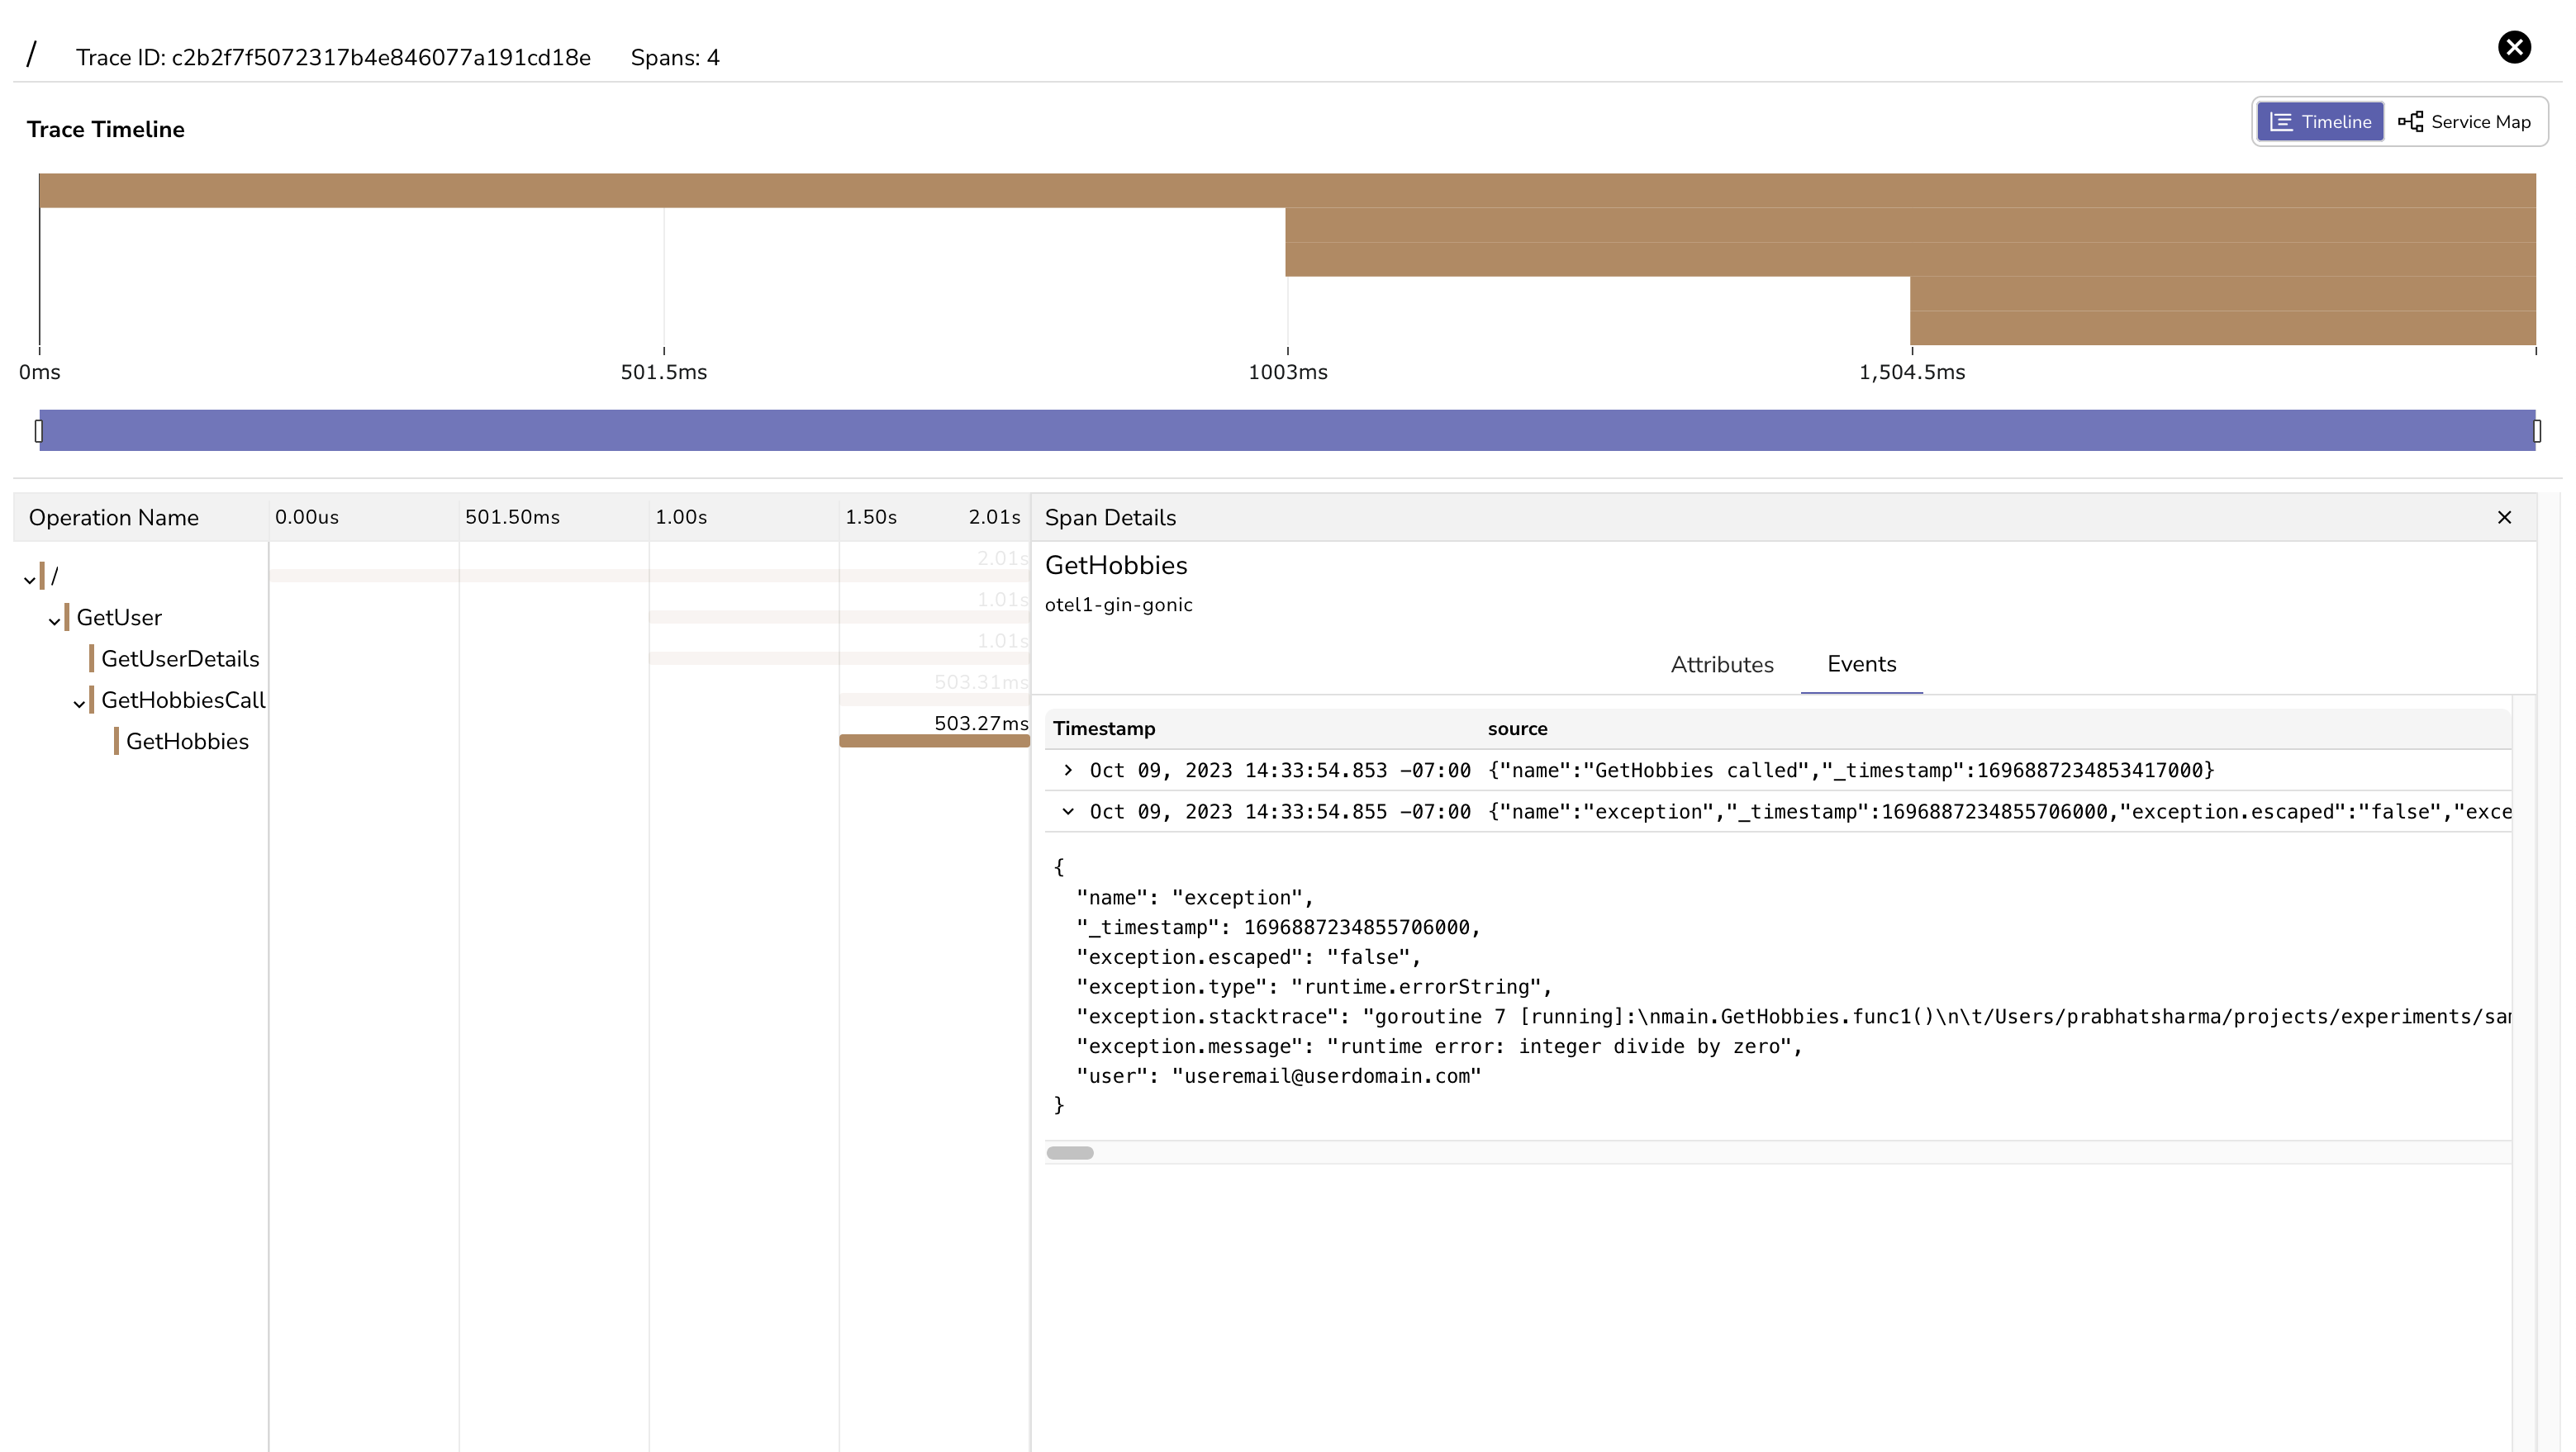
Trace can have multiple spans, each span represents single operation or task within that trace. Click on any span to check span details.
Last updated on