
Amazon Bedrock Agents → OpenObserve
Automatically capture latency and invocation metadata for every Amazon Bedrock Agent call using the OpenInference Bedrock instrumentation.
Prerequisites
- Python 3.8+
- An OpenObserve account (cloud or self-hosted)
- Your OpenObserve organisation ID and Base64-encoded auth token
- AWS credentials with
AmazonBedrockFullAccesspermissions - A Bedrock Agent with an Agent ID and Alias ID. See Create a Bedrock agent.
Installation
pip install openobserve-telemetry-sdk openinference-instrumentation-bedrock boto3 python-dotenvConfiguration
Create a .env file in your project root:
OPENOBSERVE_URL=https://api.openobserve.ai/
OPENOBSERVE_ORG=your_org_id
OPENOBSERVE_AUTH_TOKEN=Basic <your_base64_token>

AWS_ACCESS_KEY_ID=your-access-key-id
AWS_SECRET_ACCESS_KEY=your-secret-access-key
AWS_DEFAULT_REGION=your-aws-region
BEDROCK_AGENT_ID=your-agent-id
BEDROCK_AGENT_ALIAS_ID=TSTALIASID
Instrumentation
Call BedrockInstrumentor().instrument() before creating any boto3 client.
from dotenv import load_dotenv
load_dotenv()

from openinference.instrumentation.bedrock import BedrockInstrumentor
from openobserve import openobserve_init

BedrockInstrumentor().instrument()
openobserve_init(resource_attributes={"service.name": "amazon-bedrock-agents"})

import os, uuid, boto3

client = boto3.client(
    "bedrock-agent-runtime",
    region_name=os.environ.get("AWS_DEFAULT_REGION", "us-east-1"),
)

response = client.invoke_agent(
    agentId=os.environ["BEDROCK_AGENT_ID"],
    agentAliasId=os.environ.get("BEDROCK_AGENT_ALIAS_ID", "TSTALIASID"),
    sessionId=str(uuid.uuid4()),
    inputText="What can you help me with?",
)
completion = ""
for event in response.get("completion", []):
    if "chunk" in event:
        completion += event["chunk"]["bytes"].decode("utf-8")
print(completion)
What Gets Captured
| Attribute | Description |
|---|---|
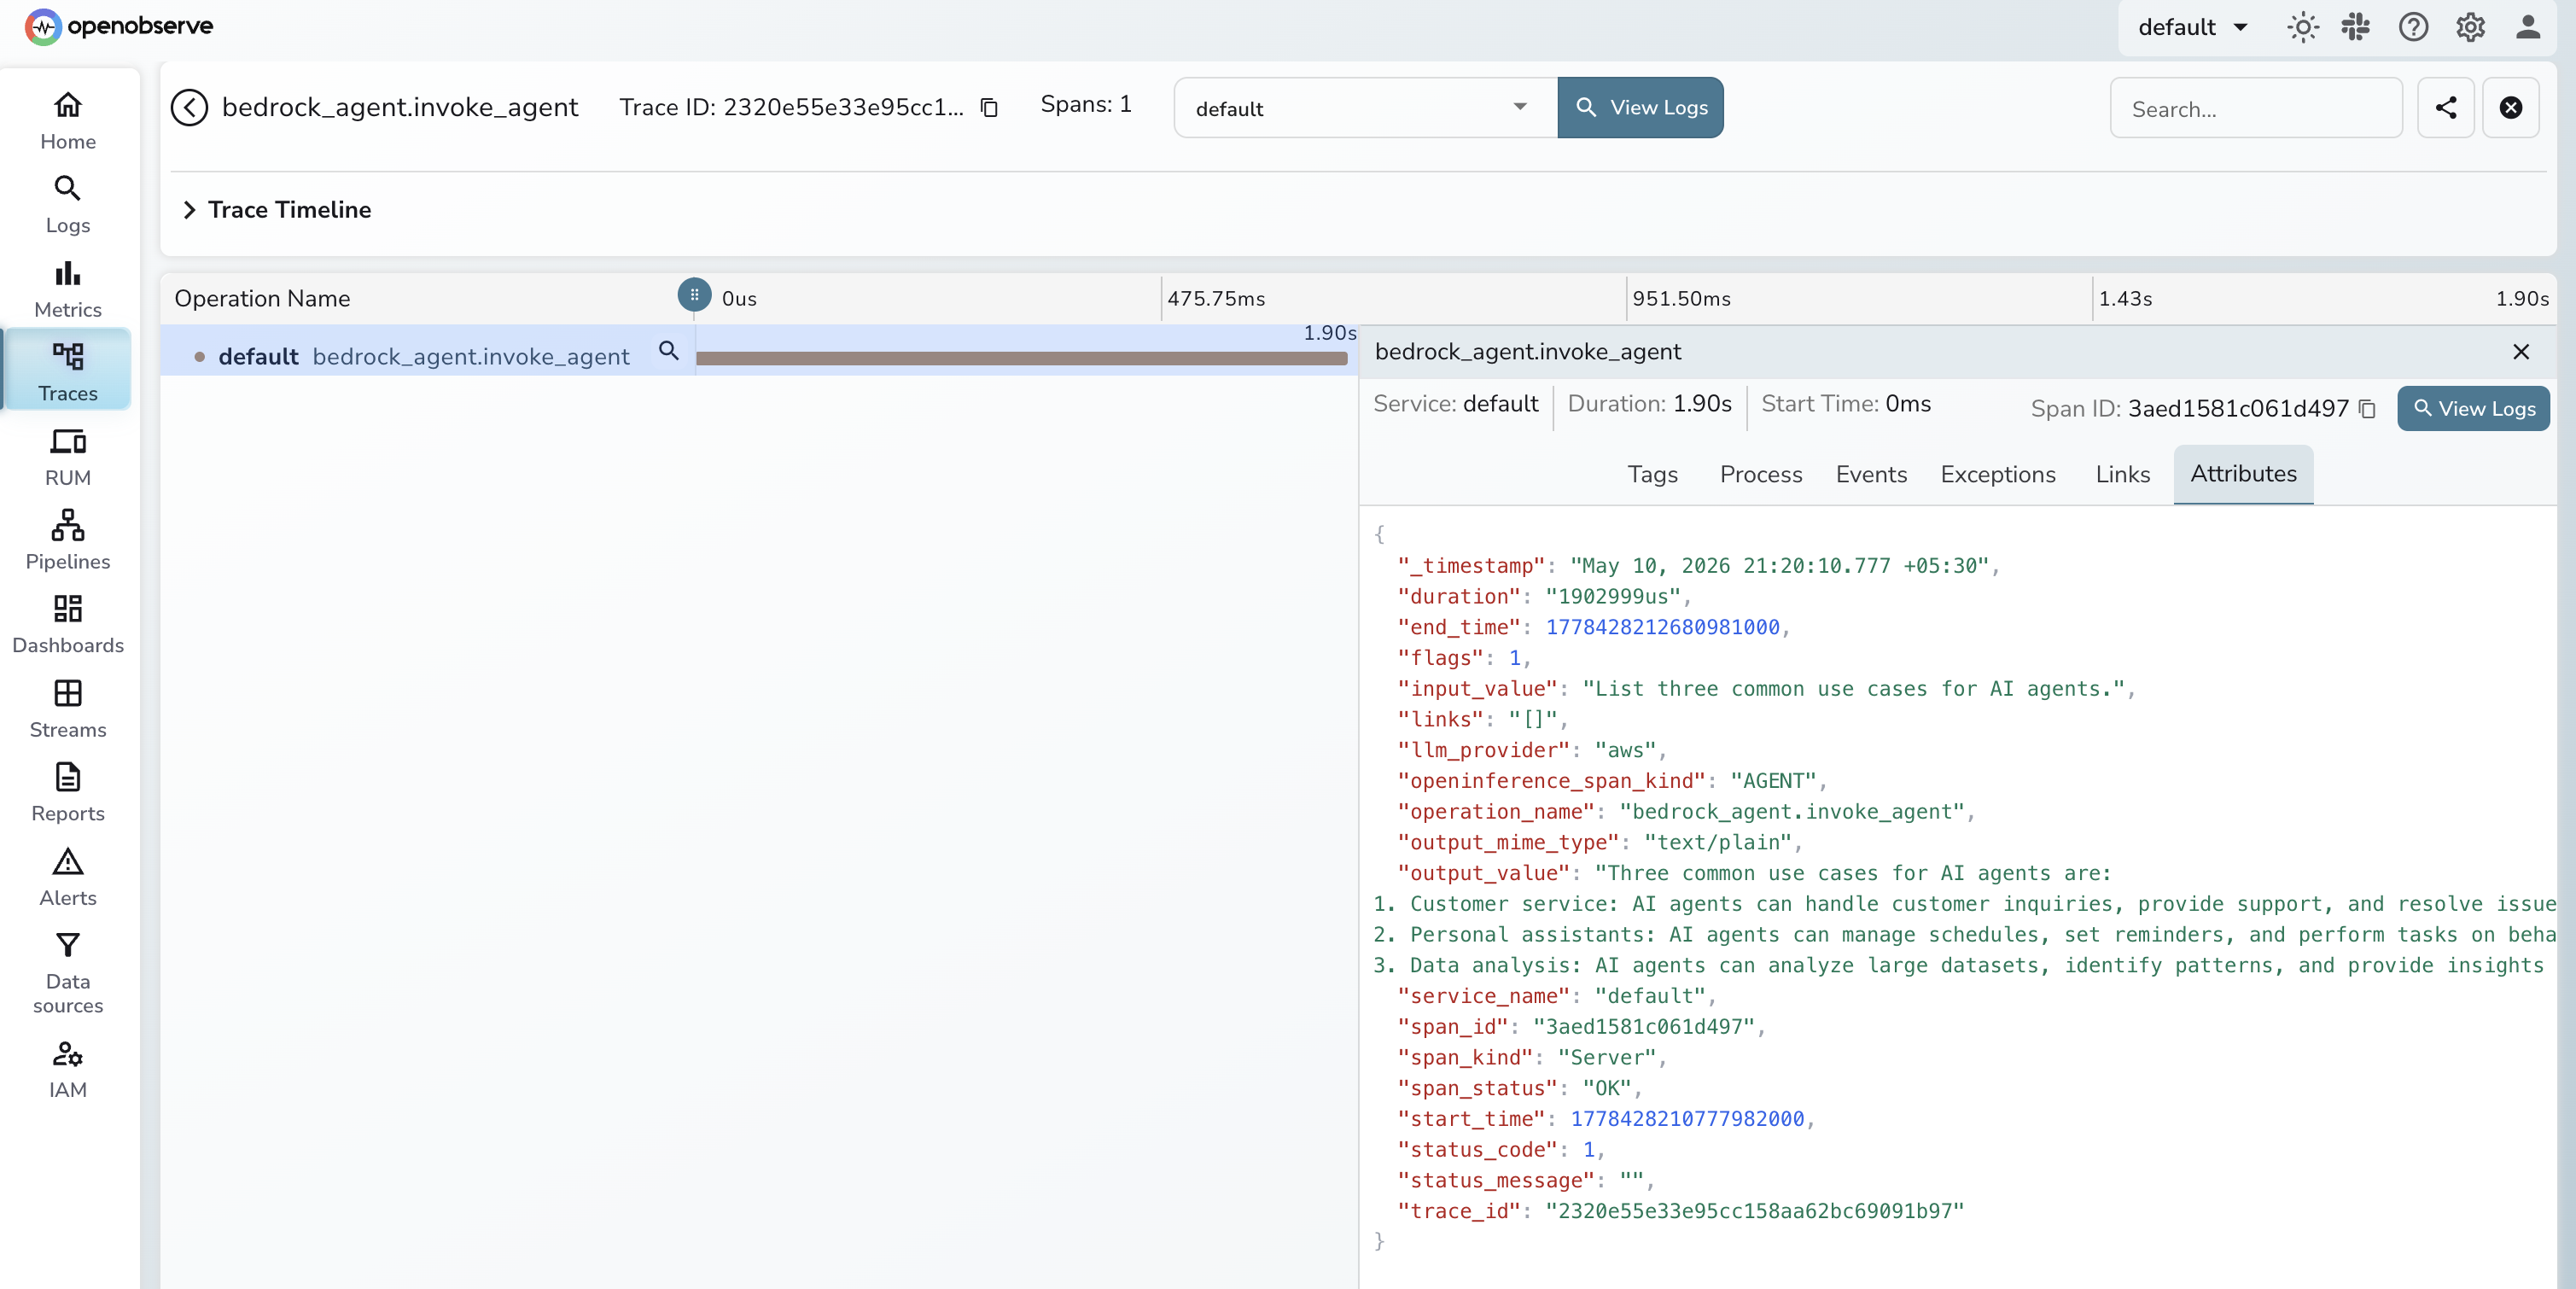
operation_name | Always bedrock_agent.invoke_agent |
openinference_span_kind | Always AGENT |
llm_provider | Always aws |
input_value | Text sent to the agent |
output_value | Agent response text |
output_mime_type | Always text/plain |
span_status | OK on success, ERROR on failure |
duration | End-to-end invocation latency |
Viewing Traces
- Log in to OpenObserve and navigate to Traces in the left sidebar
- Click any
bedrock_agent.invoke_agentspan to inspect latency and input/output content
Next Steps
Track agent response times, monitor failure rates, and correlate agent spans with the rest of your application traces.
Read More
Was this page helpful?
Last updated on