
Linux Server Monitoring - System Logs & Performance Metrics
Monitor Linux servers with comprehensive Linux server monitoring for collecting Linux system logs, server performance metrics, and infrastructure data. This guide explains how to integrate Linux systems with OpenObserve for Linux monitoring, server observability, and infrastructure monitoring using the OpenObserve Collector or OpenTelemetry Collector.
Overview
Linux server monitoring requires collecting system logs and server performance metrics. Linux systems generate two primary types of monitoring data: system logs (syslog, journald) and performance metrics (CPU, memory, disk, network). Collecting and analyzing Linux monitoring data is essential for maintaining server health, Linux performance optimization, and server security.
Installation Options
OpenObserve provides two approaches to monitor Linux systems:
- OpenObserve Collector: A simple, one-command installation recommended for most users.
- OpenTelemetry Collector: A flexible option for advanced or customized environments.
Steps to integrate
Prerequisites
- A Linux machine such as Ubuntu, Debian, CentOS, or RHEL
- Root or sudo access to install and configure services
- Access to an OpenObserve instance, either cloud or self-hosted
Steps
- Log in to your OpenObserve instance.
- Navigate to Data Sources > Recommended > Linux.
- Copy the provided installation command. The command includes your endpoint and API key.
- Run the command in your terminal:
curl -O https://raw.githubusercontent.com/openobserve/agents/main/linux/install.sh && chmod +x install.sh && sudo ./install.sh https://your-openobserve-instance.com/api/default/ YOUR_API_KEY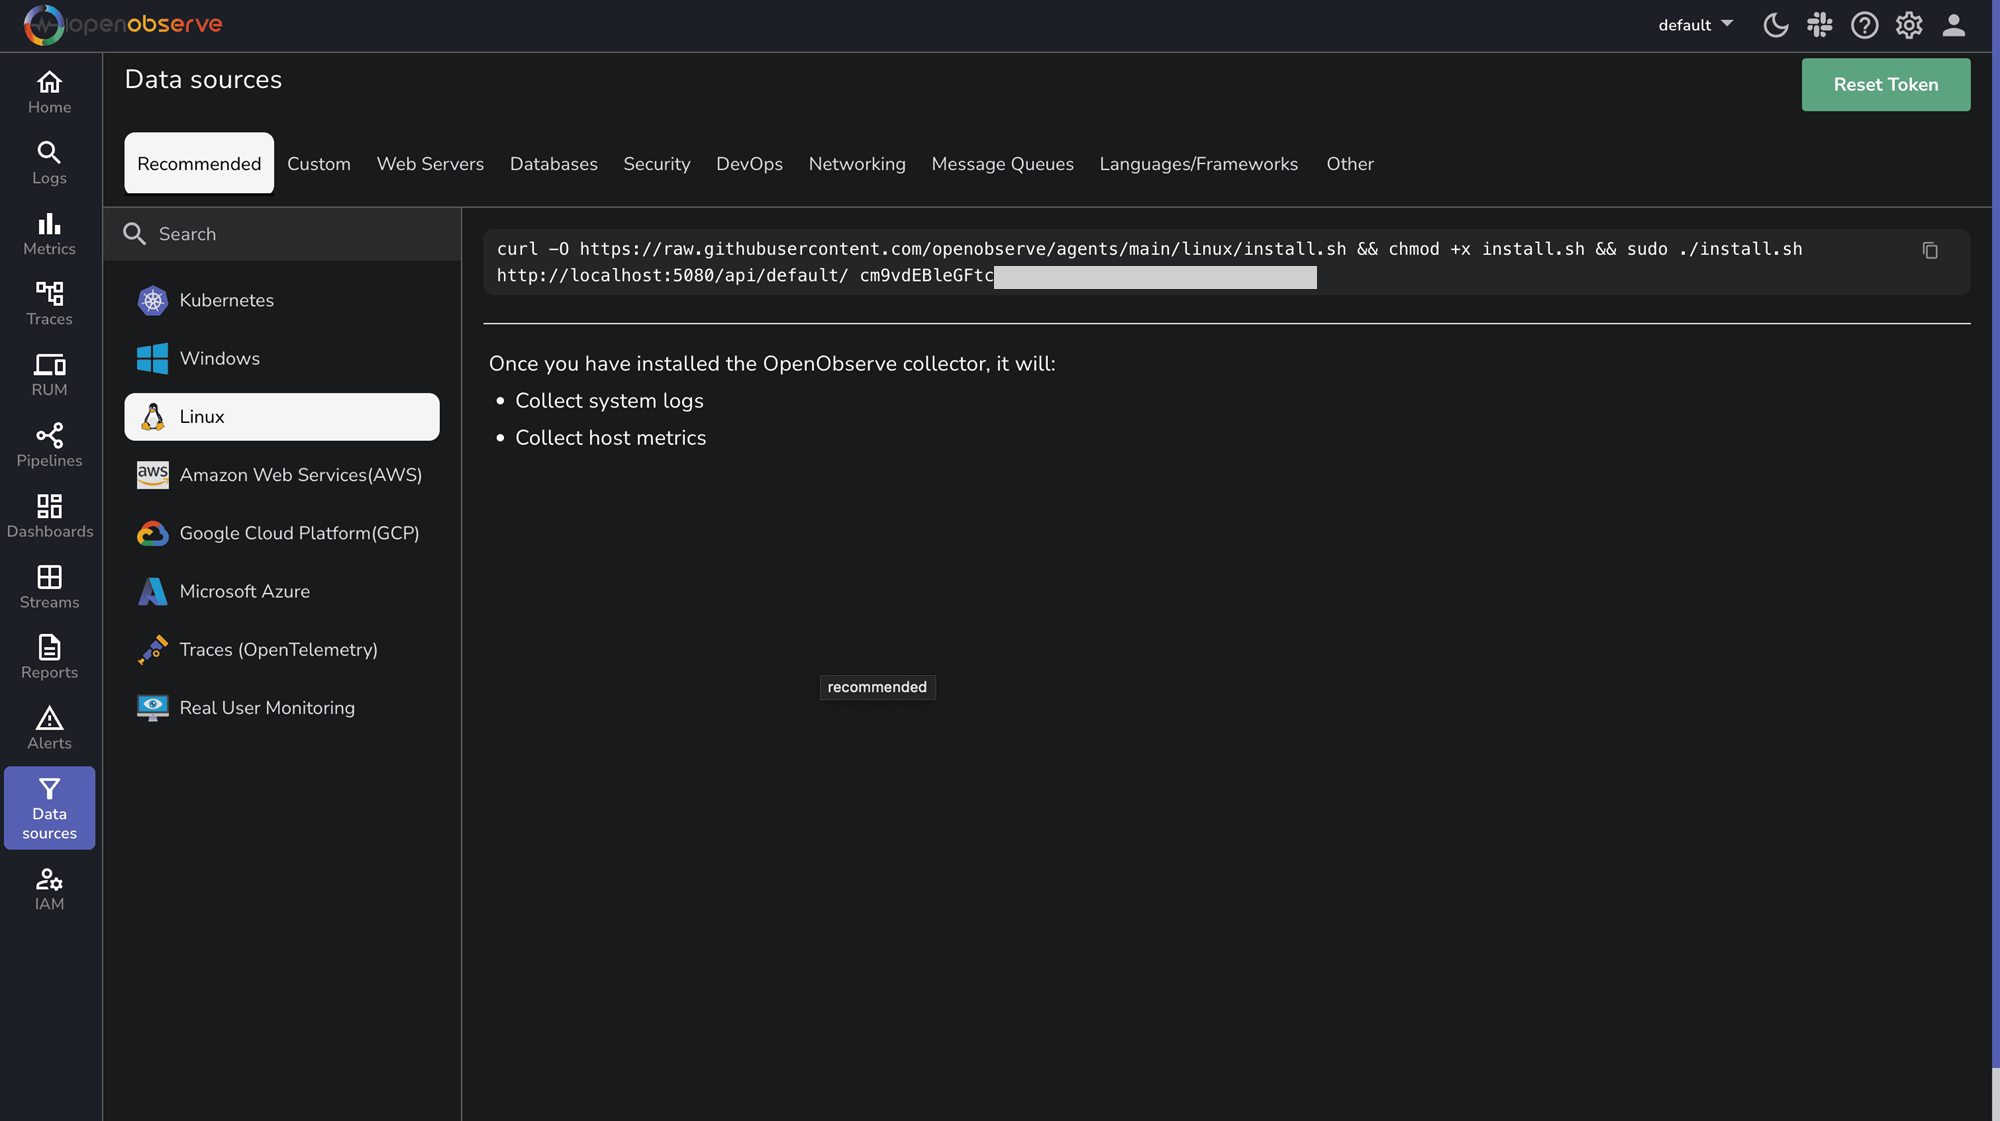
What the OpenObserve Collector Does:
- Installs as a systemd service
- Collects system logs from journald or syslog
- Collects host metrics including CPU, memory, disk, network, and process-level usage
- Forwards all collected data to OpenObserve
Steps
- Set Up the OpenTelemetry Collector Check for the latest version of the OpenTelemetry Collector on the official releases page.
sudo mkdir -p /opt/otel-collector
cd /opt/otel-collector
curl -L https://github.com/open-telemetry/opentelemetry-collector-releases/releases/download/v0.115.0/otelcol-contrib_0.115.0_linux_amd64.tar.gz -o otelcol-contrib.tar.gz
tar -xzf otelcol-contrib.tar.gz- Configure the OpenTelemetry Collector
Create a file named
config.yamlin the/opt/otel-collectordirectory with the following content:
receivers:
filelog:
    include:
    - /var/log/syslog
    - /var/log/auth.log
    - /var/log/kern.log
    - /var/log/messages
    - /var/log/secure
    start_at: end
    include_file_path: true
    include_file_name: true
    operators:
    - type: regex_parser
        regex: '^(?P<time>[A-Z][a-z]{2}\s+\d{1,2}\s+\d{2}:\d{2}:\d{2})\s+(?P<host>[^\s]+)\s+(?P<service>[^\s\[]+)(\[(?P<pid>\d+)\])?:\s+(?P<message>.*)$'
        timestamp:
        parse_from: time
        layout: Jan 02 15:04:05

hostmetrics:
    collection_interval: 30s
    scrapers:
    cpu:
        metrics:
        system.cpu.utilization:
            enabled: true
    memory:
        metrics:
        system.memory.utilization:
            enabled: true
    disk:
    filesystem:
    network:
    load:
    paging:
    process:
        mute_process_name_error: true
        metrics:
        process.cpu.utilization:
            enabled: true
        process.memory.utilization:
            enabled: true

processors:
batch:
    send_batch_size: 1024
    timeout: 10s
resourcedetection:
    detectors: [system, env]
    system:
    hostname_sources: ["os"]

exporters:
otlphttp/openobserve:
    endpoint: "https://your-openobserve-instance.com/api/default"
    headers:
    Authorization: "Basic YOUR_API_KEY"
    stream-name: "linux-logs"
debug:
    verbosity: detailed

service:
pipelines:
    logs:
    receivers: [filelog]
    processors: [resourcedetection, batch]
    exporters: [otlphttp/openobserve, debug]
    metrics:
    receivers: [hostmetrics]
    processors: [resourcedetection, batch]
    exporters: [otlphttp/openobserve, debug]
telemetry:
    logs:
    level: "info"
Replace https://your-openobserve-instance.com/api/default with your OpenObserve endpoint and YOUR_API_KEY with your actual API key.
3. Run the Collector
sudo ./otelcol-contrib --config config.yamlAdvanced Configuration Options
Here are some essential configurations to enhance your Linux monitoring:
Security-Focused Monitoring
For enhanced security monitoring:
filelog:
include:
    - /var/log/auth.log
    - /var/log/secure
    - /var/log/audit/audit.log
operators:
    # For SSH authentication events
    - type: router
    routes:
        - expr: 'includes(file.name, "auth.log") or includes(file.name, "secure")'
        output: auth-parser
    - type: regex_parser
    id: auth-parser
    regex: '(?P<time>[A-Z][a-z]{2}\s+\d{1,2}\s+\d{2}:\d{2}:\d{2})\s+(?P<host>[^\s]+)\s+sshd\[(?P<pid>\d+)\]:\s+(?P<message>.*)'
    timestamp:
        parse_from: time
        layout: Jan 02 15:04:05
This configuration focuses on authentication logs to help detect unauthorized access attempts and potential security breaches.
Using Journald Receiver
If you prefer to collect logs directly from journald instead of log files:
journald:
units:
    - ssh.service
    - systemd-logind.service
priority: info
The journald receiver requires systemd and only works on Linux systems using systemd as their init system.
Troubleshooting
OpenObserve Collector Installation Issues
- Permission Denied: Run the installation command with
sudo. - Service Not Starting: Check status with
sudo systemctl status openobserve-agentand look for error messages. - Network Issues: Verify connectivity with
curl -v https://your-openobserve-instance.com.
Log Collection Issues
- Missing Logs: Check file permissions and ensure the OpenObserve Collector has read access to log files.
- Journald Access: For systemd-based systems, ensure the OpenObserve Collector has proper journal access.
- Log Format Problems: If logs appear malformed, check timezone settings and log formats.
Metrics Collection Issues
- Missing Metrics: Verify the OpenObserve Collector has permissions to access system metrics.
- Performance Impact: If the OpenObserve Collector uses too many resources, adjust collection intervals.
OpenTelemetry Collector Issues
- Configuration Errors: Validate your config.yaml syntax and check OpenTelemetry Collector logs.
- Export Failures: Verify your endpoint URL and API key are correct.
- Resource Constraints: Adjust batch settings if the OpenTelemetry Collector terminates unexpectedly.
Last updated on
Kubernetes Monitoring - K8s Cluster & Container Observability
Kubernetes monitoring with OpenTelemetry and OpenObserve: cluster and container metrics, pod metrics, K8s logs, and microservices observability.
Windows Server Monitoring - Event Logs & Performance Metrics
Collect Windows event logs, server metrics, and performance data with the OpenObserve Collector for Windows server monitoring.