
Show Symbol
This guide describes how to use the Show Symbol option in OpenObserve dashboards to display or hide data point markers in supported chart types. This setting improves visual clarity when analyzing time-series data by highlighting values along a plotted line or area.
Supported Chart Types
The Show Symbol setting is available only for the following chart types:
- Line
- Area
- Area Stacked
Configure the Show Symbol Option
To configure the Show Symbol option:
-
In the Panel Editor, select a supported chart type.
-
Expand the Config section on the right side of the screen.
-
Locate the Show Symbol dropdown.
-
From the Show Symbol dropdown, select Yes or No:
- When you select Yes, each data point is marked with a small circle for clear identification.
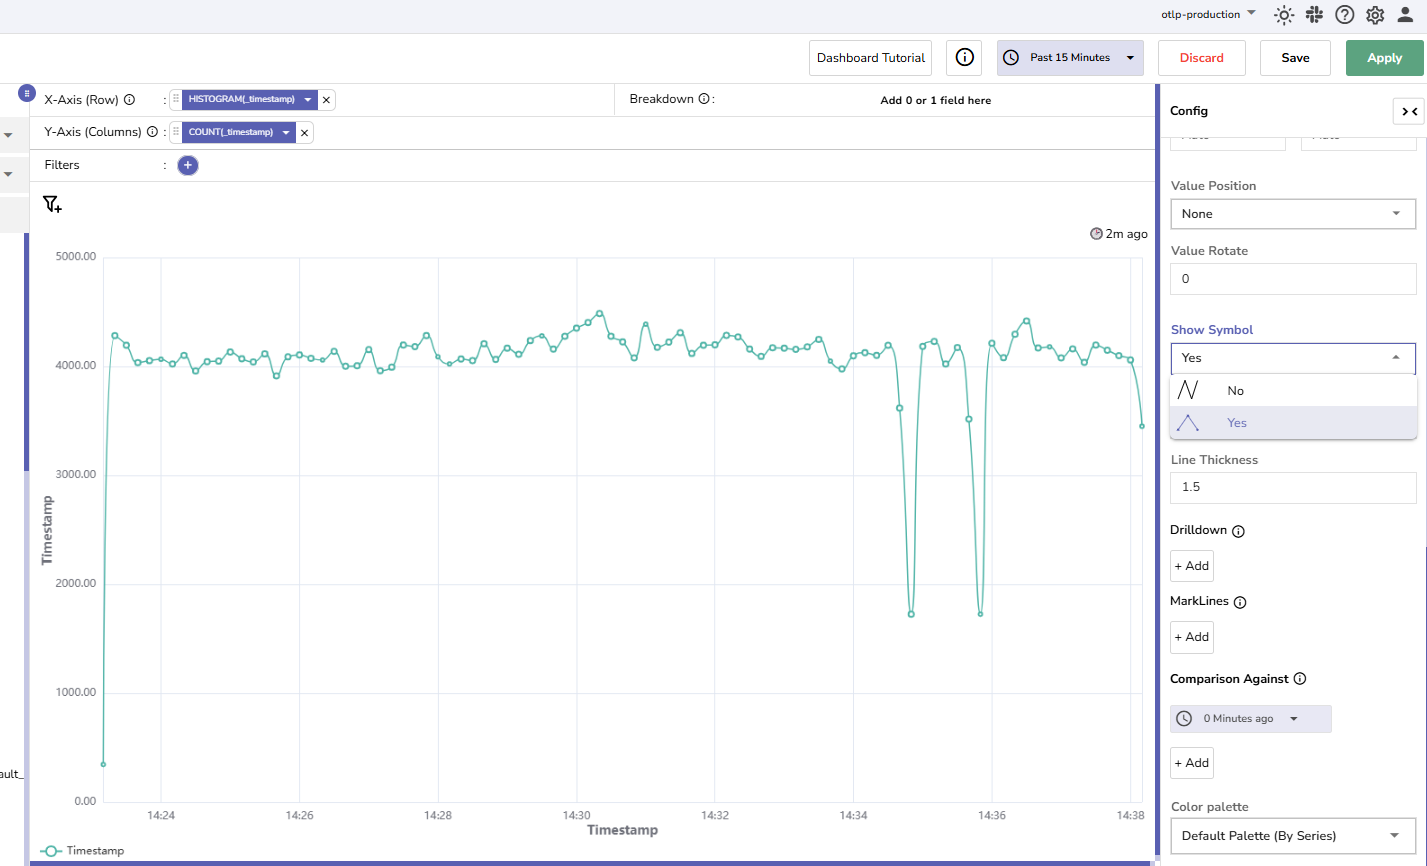
- When you select No, the chart renders a continuous line or area without individual point markers.
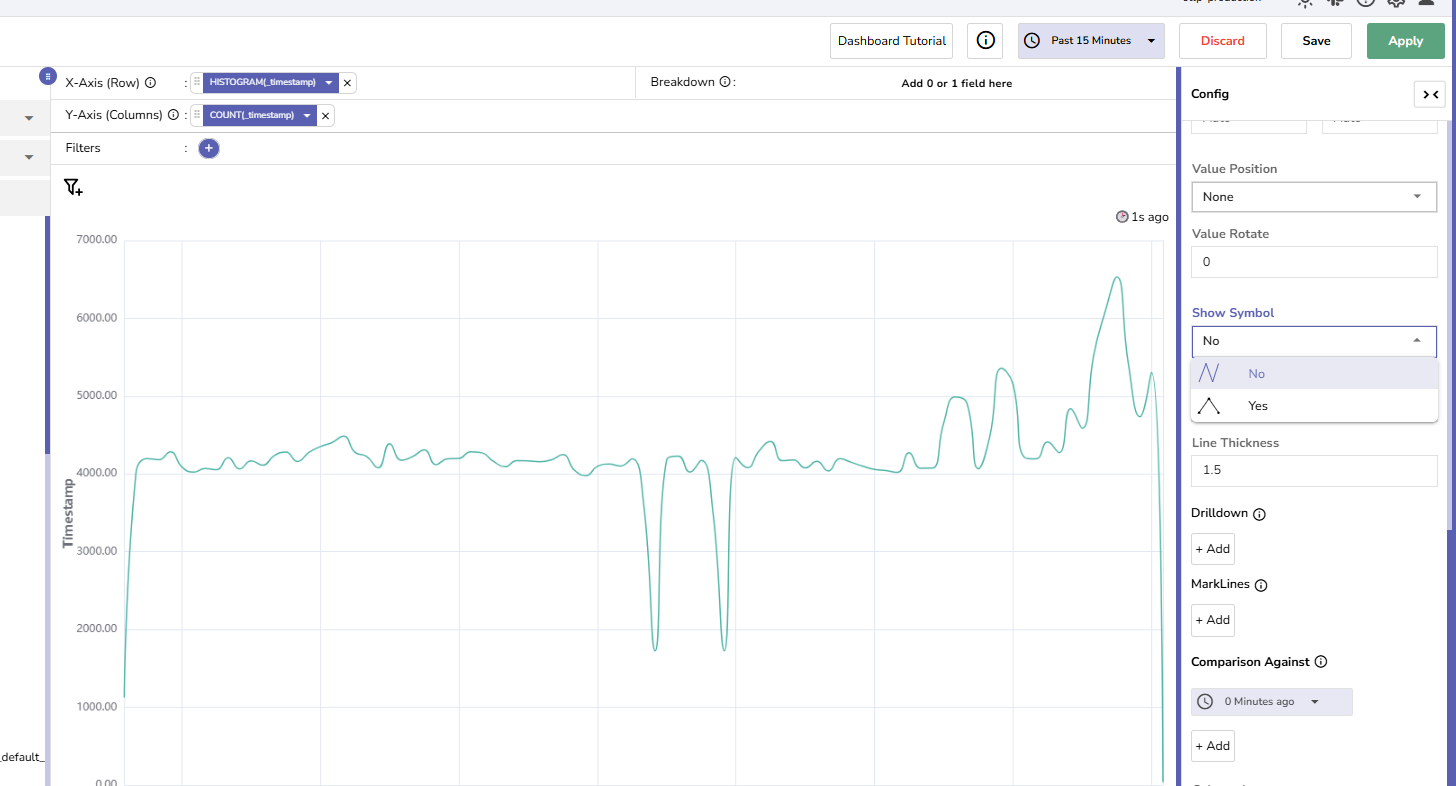
- When you select Yes, each data point is marked with a small circle for clear identification.
Default Behavior and Environment Variable
The default selection of the Show Symbol dropdown is determined by the following environment variable:
ZO_DASHBOARD_SHOW_SYMBOL_ENABLED=false # default- When set to true, the Show Symbol dropdown defaults to Yes.
- When set to false, the Show Symbol dropdown defaults to No.
This setting only controls the default state of the Show Symbol dropdown. Users can manually change the setting regardless of the environment variable value.
Limitations
The Show Symbol option is supported only in Line, Area, and Area Stacked charts. It is not available for any other chart types in dashboard panels. If a different chart type is selected, the Show Symbol option will not appear in the configuration panel.
Last updated on
Trellis Layout
Use Trellis Layout under the Config tab to split a chart into multiple panels by a breakdown field, making grouped values easy to compare.
Show Field as JSON
Learn how to use the Show Field as JSON option to render a field's value as structured, colored JSON in OpenObserve dashboard table panels.