
Count SLOs
A count SLO measures good events divided by total events. Use it when your signal represents discrete units of work — requests, jobs, payments, spans — and you can identify both the good events and the complete population.
SLI = 100 × good events / total eventsOpenObserve can obtain those counts in two ways:
- SQL counts rows in a logs, metrics, or traces stream. A scope defines the denominator and a boolean predicate identifies good rows. In the SLO form, both numbers come from one scan, so they cannot drift apart.
- PromQL evaluates separate good and total expressions over metrics. This
is the right shape for monotonic counters, where
increase()handles resets and turns samples into event counts.
When to use it
| Question | Count SLO? |
|---|---|
| What share of API requests did not return 5xx? | Yes |
| What share of background jobs finished successfully? | Yes |
| What share of payments were authorized? | Yes |
| Was p95 latency under 300 ms? | No — use a time-slice SLO |
| Was the disk-space alert quiet? | No — use an alert-based SLO |
The distinguishing test is whether the objective weights events. With SQL, "good" is a property of an individual row; with PromQL, good and total are event counts derived from counters. If you need to aggregate a gauge or latency distribution before you can judge a period, use a time-slice SLO.
Configuration
Select Count as the SLI type, then choose a stream type and stream. Logs and traces use SQL. For metrics, the Query language selector offers PromQL (the default) and SQL.
| Language | Fields that define the SLI | Best for |
|---|---|---|
| SQL | Optional Scope and required Good when predicate | Streams with one event per row, including raw metric samples when each sample is itself the unit you intend to count |
| PromQL | Required Good events and Total events expressions | Metrics counters that must be converted into per-slice event counts with increase() |
SQL can query a metrics stream, but counting its rows usually counts samples, not the events represented by a counter. Use PromQL for monotonic counters.
SQL count configuration
Both expressions are SQL fragments over the stream's fields — the same dialect you use in the log search bar. The editor autocompletes field names and values for the selected stream.
Scope is the denominator
Scope is not cosmetic. It decides what the SLO is about.
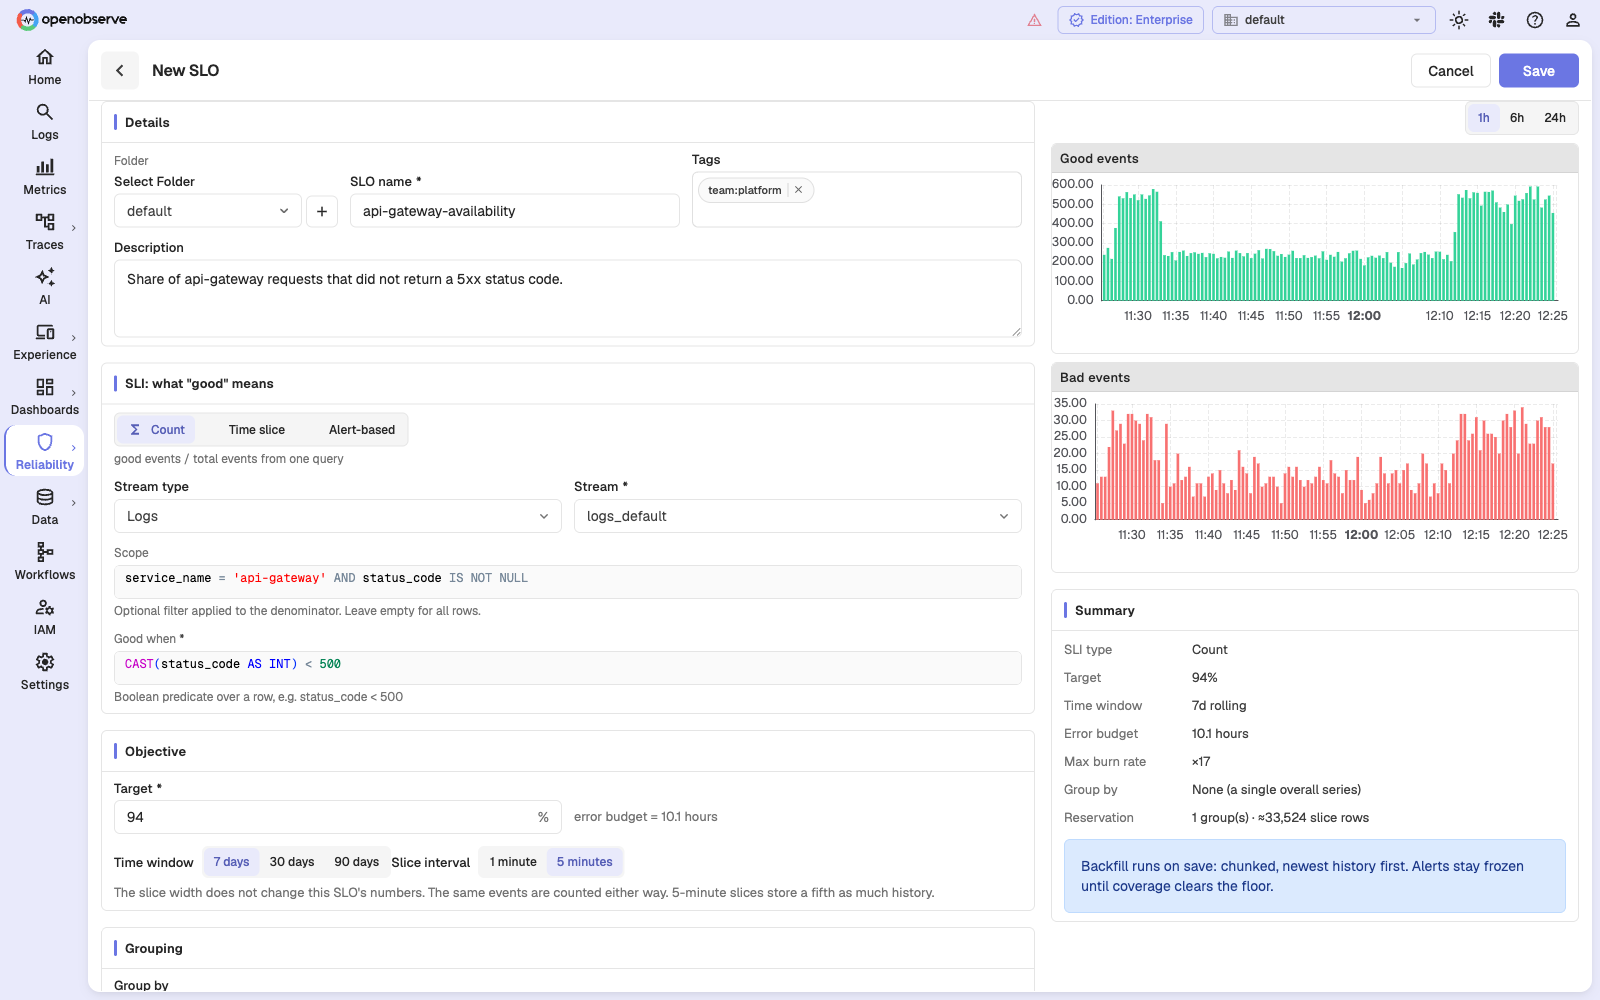
Scope:     service_name = 'api-gateway' AND status_code IS NOT NULL
Good when: CAST(status_code AS INT) < 500
This measures "of the api-gateway rows that describe an HTTP response, what
fraction were not a server error". Rows without a status_code — health checks,
startup logs, anything that is not a request — are excluded from both sides
rather than silently counted as successes.
Dropping the status_code IS NOT NULL clause would put every api-gateway log
line in the denominator, and the SLI would mostly measure how chatty the service
is.
Leaving Scope blank means "all rows in the stream"; the form omits the field
rather than sending an empty string. If you are posting to the API directly,
omit scope entirely — an empty string is rejected as an empty predicate, not
read as "all rows".
Good when
Good when is evaluated per row and must be a boolean expression. Some working
shapes:
-- HTTP success
CAST(status_code AS INT) < 500

-- explicit success flag
status = 'success'

-- successful and fast enough
status = 'success' AND CAST(duration_ms AS DOUBLE) < 1000

-- anything that is not a hard failure
severity NOT IN ('ERROR', 'FATAL')
Fields ingested as strings need an explicit cast before numeric comparison, as in the examples above.
PromQL count configuration
After selecting a metrics stream, leave Query language set to PromQL. The SQL fields are replaced by two PromQL editors:
| Field | Meaning |
|---|---|
| Good events (PromQL) | The numerator: the counter increase for events that count as good. |
| Total events (PromQL) | The denominator: the counter increase for every event in the population. This is the total, not the complement of the good expression. |
For example, if one request counter carries a status label:
# Good events
sum(increase(http_requests_total{status_code!~"5.."}[5m]))

# Total events
sum(increase(http_requests_total[5m]))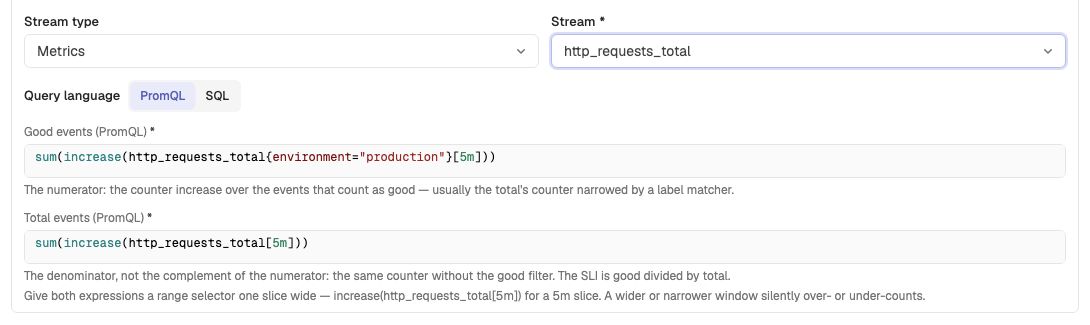
Keep these rules in mind:
- Give both expressions a range selector exactly one slice wide:
[1m]for a 1-minute slice or[5m]for a 5-minute slice. OpenObserve evaluates at slice ends; a wider or narrower range silently overcounts or undercounts. If you change the slice interval later, update both range selectors as part of the same edit. - Make sure good and total describe the same population and preserve every configured Group by label. The two expressions are evaluated separately, so they do not have the single-scan atomicity of the SQL source.
- Derive good and total from the same counter whenever possible. Subtracting a separate error counter can return no good series in a healthy slice where the error series does not exist. Filter the request counter by a status or outcome label instead.
- Use
increase()for counters instead of subtracting raw samples yourself. It accounts for monotonic counter resets. Choose a slice that normally contains at least two samples; a range with too few samples returns no value. - The preview plots Good events and Total events. Unlike the SQL preview, it does not derive bad events as the complement of good rows.
PromQL is accepted only for metrics. To filter it, put label matchers in the expressions; the SQL Scope field is not part of a PromQL count definition. OpenObserve parses both expressions on save and reports invalid PromQL before it starts backfill.
The selected metrics stream supplies the available Group by labels. PromQL autocomplete derives metric and label suggestions from the expression itself, and the saved PromQL source stores the expressions rather than a stream name. When editing an existing PromQL count SLO, reselect a metrics stream if you need to repopulate the Group by list.
PromQL grouping
For a grouped PromQL count SLO, the returned series labels supply the group
values. If Group by contains region, return a region label from both
expressions, for example:
# Good events
sum by (region) (
  increase(http_requests_total{status_code!~"5.."}[5m])
)

# Total events
sum by (region) (increase(http_requests_total[5m]))
OpenObserve folds any extra labels down to the configured group grain by adding their event counts. If a configured group label is missing, its value is recorded as empty. The SLO preview folds all returned series into an overall rollup and does not display or validate their labels. Before saving, run the expression in Metrics and inspect its output labels to make sure both expressions preserve every configured group label.
SQL worked example
Goal: the API gateway should serve at least 94% of requests without a server error, measured over a rolling 7 days.
| Setting | Value |
|---|---|
| SLI type | Count |
| Stream | logs_default (logs) |
| Scope | service_name = 'api-gateway' AND status_code IS NOT NULL |
| Good when | CAST(status_code AS INT) < 500 |
| Target | 94% |
| Time window | 7 days |
| Slice interval | 5 minutes |
| Tags | team:platform |
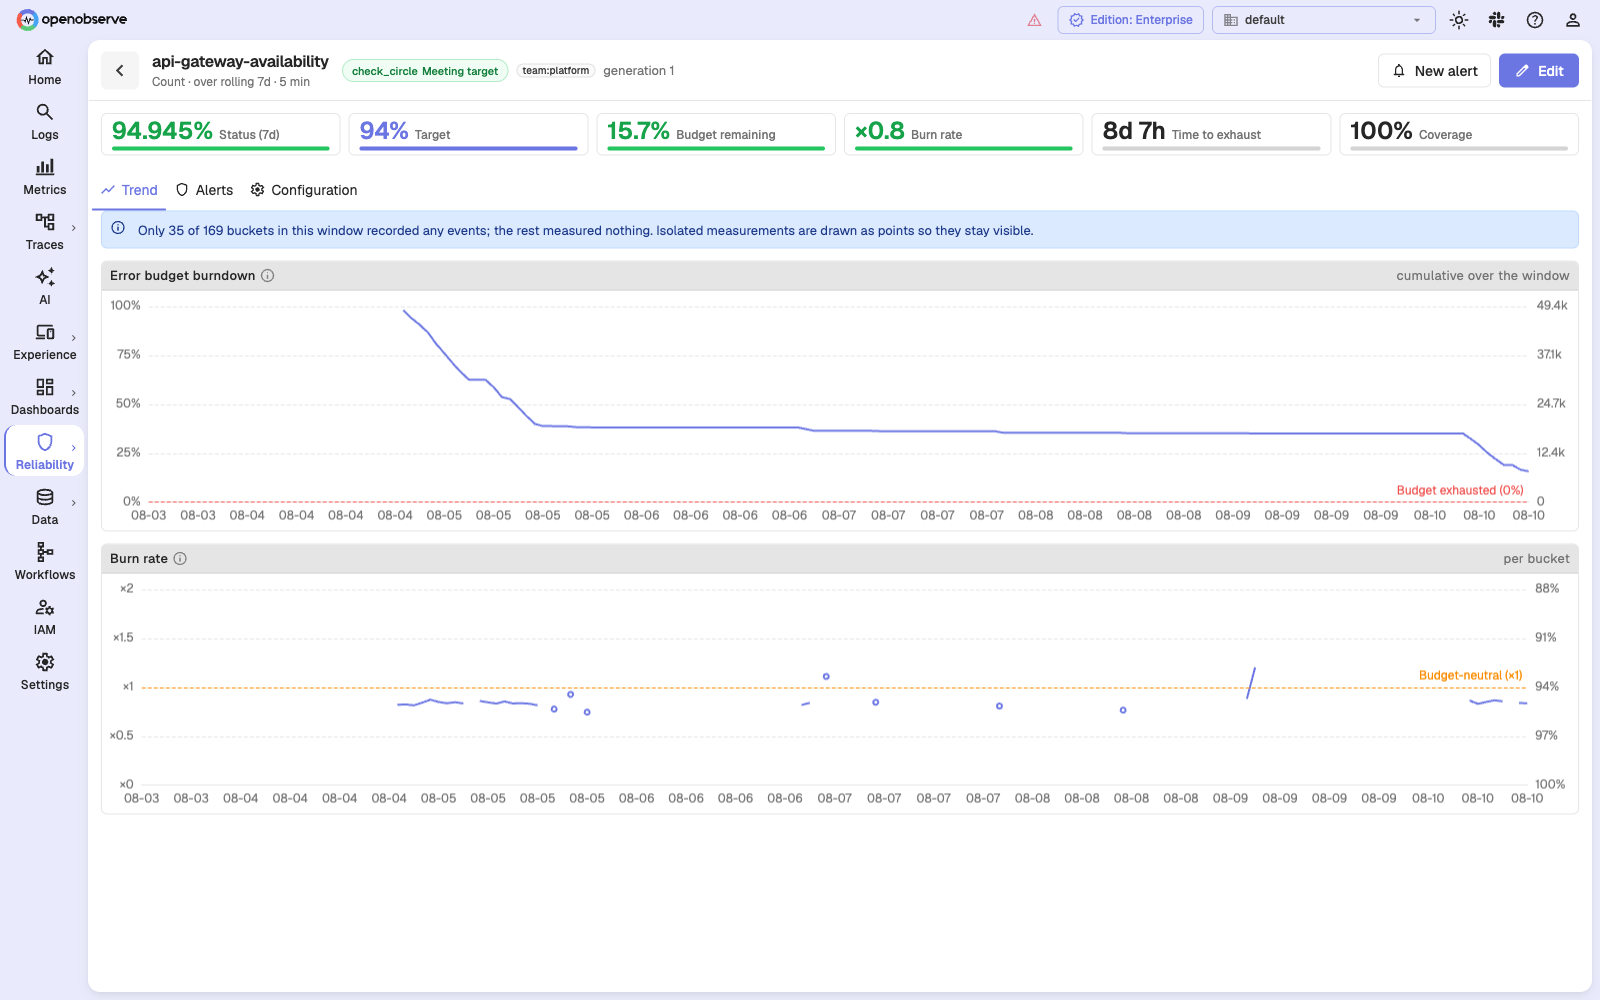
Reading the result:
- SLI 94.946% — that is
good / totalover the last 7 days. - Error rate 5.054% —
100 − SLI. - Error budget 6% —
100 − 94, which over 7 days is about 10.1 hours. - Budget consumed 84.2% —
5.054 / 6. - Budget remaining 15.8% — what is left.
- Burn rate ×0.8 — below budget-neutral, so at this pace the SLO ends the window inside its budget.
- Time to exhaust 8d 7h — longer than the window, which is another way of saying the same thing.
PromQL worked example
Goal: at least 99.9% of HTTP requests should complete without an error, measured from counters over a rolling 30 days.
| Setting | Value |
|---|---|
| SLI type | Count |
| Stream | http_requests_total (metrics) |
| Query language | PromQL |
| Good events | sum(increase(http_requests_total{status_code!~"5.."}[5m])) |
| Total events | sum(increase(http_requests_total[5m])) |
| Target | 99.9% |
| Time window | 30 days |
| Slice interval | 5 minutes |
| Tags | team:platform |
Choosing the slice interval
For a SQL count SLO, the slice interval does not change the numbers. The same
rows are counted either way because both good and total are sums.
For a PromQL count SLO, changing the slice also changes the evaluation grid and
requires matching range selectors. Although the expressions are intended to
cover the same event population, increase() extrapolation and sample density
mean that five 1-minute evaluations do not necessarily equal one 5-minute
evaluation. Choose a slice that normally contains at least two counter samples,
and update both range selectors whenever you change it.
Pick 5 minutes unless you have a reason not to: it stores a fifth as much history for the same answer. Choose 1 minute only when you want finer resolution in the burndown chart, or when you intend to attach burn-rate alerts with very short windows — the short window must be at least two slices wide.
Grouping
Set Group by to one or more fields to measure each distinct value
separately — for example region, or service_name, or tenant_id.
- Each group gets its own SLI, budget, and burn rate.
- An exact overall rollup is measured alongside the groups; it is not a sum of the truncated group list.
- Grouped SLOs are pinned to 5-minute slices.
- The default cap is 500 groups per SLO. Exceeding it is reported as an
overflow, not silently truncated, so pick a field with bounded cardinality.
regionis a good grouping key;user_idis not.
The Cardinality estimate field sizes the storage reservation. Twice the estimate is reserved — with a floor of 64 groups and a ceiling at the hard cap — to leave headroom for organic growth.
Empty slices and low-traffic services
Two different situations look similar and are treated very differently.
The query ran and found nothing. For a count SLI that is a real observation of zero traffic, so the slice is recorded as measured with zero events. It does not lower coverage, and because it adds nothing to either the numerator or the denominator, it does not move the SLI either.
The query never ran, or failed. That is a gap. It lowers coverage, and
once coverage drops below ZO_SLO_MIN_COVERAGE (default 0.9) the SLO reads as
No data and its alerts freeze.
PromQL count expressions are joined using the total result as the population. For each total point, a missing matching good point is stored as zero good events; a good-only point with no matching total is ignored. If good exceeds total, OpenObserve caps good at total before storing the slice. A successful PromQL evaluation with no total points becomes a measured zero-traffic slice, not a gap. These rules are another reason to derive good and total from the same counter with aligned labels. The preview plots the raw query results, so it can differ from the stored values when a join is missing or good exceeds total.
This is the opposite of how a time-slice SLO treats an empty period, and the difference is deliberate: counting events over an empty period is well defined, computing a percentile over one is not.
There is still a low-traffic failure mode, but it is a different one. If the whole window ends up covered with no events at all, the SLI is undefined — zero divided by zero — and the SLO freezes with no data even though coverage reads 100%. Traffic stopping entirely is usually the incident, not a recovery, so the safe behaviour is to refuse to answer rather than to report either 0% or 100%.
If you are measuring something that legitimately goes quiet for long stretches, model it as a time-slice SLO instead, which can be configured to treat a proved-empty period as a failure.
Next steps
Last updated on
Service Level Objectives (SLOs)
How SLOs work in OpenObserve: service level indicators, targets, rolling windows, time slices, error budgets, burn rate, coverage, and the three SLI types.
Time-Slice SLOs
Create SQL or PromQL time-slice SLOs in OpenObserve: score each slice with an aggregate such as p95 latency and measure uptime as the share of good slices.