
Time-slice SLOs
A time-slice SLO measures good slices divided by measured slices. Instead of judging individual events, it computes one aggregate per slice, compares it against a threshold, and scores the whole slice good or bad.
per slice:  aggregate(data in this slice)  comparator  threshold   →  good | bad
SLI      =  100 × good slices / measured slices
Internally a good slice is stored as its full width in seconds and a bad one as zero, which is why the burndown chart describes this SLI in seconds. The ratio is identical either way.
This is the shape most people mean by "uptime": the service was up for 99.5% of the last 30 days' five-minute periods.
When to use it
Use a time-slice SLO when "good" is a property of a period, not of a row:
- Latency: p95 response time under 300 ms.
- Saturation: queue depth below 1000, connection pool utilization under 80%.
- Freshness: the pipeline's lag below five minutes.
- Availability from a probe: the success rate of synthetic checks in each five-minute window above 99%.
The tell is that you have to aggregate before you can decide. A percentile does not exist for a single row.
Configuration
Select Time slice as the SLI type, then choose a stream type and stream. Logs and traces use SQL. For metrics, use the Query language selector to choose PromQL (the default) or SQL.
| Field | Required | Meaning |
|---|---|---|
| Stream type | Yes | Logs, metrics, or traces. PromQL is available only for metrics. |
| Stream | Yes | For SQL, the stream to aggregate. For PromQL, an advisory metrics selection that supplies the Group by field list; the expression itself names the metrics to query. |
| Query language | Metrics only | PromQL or SQL. The choice changes the expression editor and whether Scope is available. |
| Aggregate / PromQL expression | Yes | An expression evaluated once per slice, producing one number per SLO group. |
| Comparator | Yes | <, <=, >, or >=. |
| Threshold | Yes | The number the aggregate is compared against. |
| Scope | SQL only | An optional SQL filter applied before aggregating. In PromQL, put label matchers inside the expression. |
The comparator list contains only ordered operators. = and != are not
offered, because a slice with no value is a gap rather than a failure, and
equality has no severity direction to fall back on.
Choosing SQL or PromQL for metrics
Both languages can query a metrics stream, but they operate at different levels:
| Choose | When |
|---|---|
| PromQL | You need counter-aware functions, range functions, histogram quantiles, or normal Prometheus label semantics. |
| SQL | You want to aggregate the metrics stream's raw value rows directly, with an optional SQL scope. |
For example, avg(value) is a valid SQL aggregate over a gauge metrics stream.
For a counter rate or histogram quantile, prefer PromQL; SQL over raw counter
samples does not reproduce rate() or increase() semantics.
SQL aggregate expressions
The aggregate is a SQL aggregate over the slice's rows:
-- p95 latency
approx_percentile_cont(CAST(response_time_ms AS DOUBLE), 0.95)

-- p99 latency
approx_percentile_cont(CAST(duration_ms AS DOUBLE), 0.99)

-- mean queue depth
avg(CAST(queue_depth AS DOUBLE))

-- worst case in the slice
max(CAST(lag_seconds AS DOUBLE))

-- success rate inside the slice
100.0 * sum(CASE WHEN status = 'success' THEN 1 ELSE 0 END) / count(*)
That last form is worth noticing: it computes a ratio, but scores the slice as a unit. It is not the same objective as the equivalent count SLO — see Time slice or count? below.
PromQL expressions
A PromQL time-slice SLO carries one expression. OpenObserve evaluates it at the end of every slice, compares the returned value with the stored comparator and threshold, and then scores the slice. Keep the comparator outside the PromQL expression so changing the threshold remains an explicit SLO edit.
Some useful shapes for a 5-minute slice:
# p95 request latency, in seconds
histogram_quantile(
  0.95,
  sum by (le) (rate(http_request_duration_seconds_bucket[5m]))
)

# mean CPU utilization across the whole slice and all returned series
avg(avg_over_time(cpu_utilization_percent[5m]))

# worst five-minute queue depth
max(max_over_time(message_queue_depth[5m]))
Use these rules when writing the expression:
- Make each range selector exactly one slice wide. For a 5-minute slice,
use
[5m]. OpenObserve evaluates PromQL at slice ends, so the sample at time T represents(T − slice interval, T]. If you change the slice interval, update the selectors too. - Prefer range functions such as
avg_over_time(metric[5m])over a bare instant expression such asavg(metric). The latter measures only the slice-ending instant, not the whole slice. - Reduce an ungrouped SLO to one series per slice. For a grouped SLO,
return one series for each configured group. For example, grouping by
regionrequires the expression to preserveregion:
histogram_quantile(
  0.95,
  sum by (le, region) (rate(http_request_duration_seconds_bucket[5m]))
)
OpenObserve does not guess how to combine multiple aggregates. If two series land on the same slice and SLO group, that slice is rejected and becomes a coverage gap under the default absence policy; two pod-level p95 values cannot safely be summed or averaged. The preview warns when an ungrouped expression returns multiple series. For a grouped expression, it counts the returned series but cannot validate that their labels map uniquely to the configured SLO groups. Run the expression in Metrics, inspect the output labels, and aggregate away every label that is not in Group by.
PromQL has no separate Scope field. Put label matchers directly in the
expression, such as http_request_duration_seconds_bucket{service_name="api"}.
OpenObserve parses the expression on save and rejects invalid PromQL before
backfill begins. It deliberately does not try to infer the output labels at
save time.
SQL worked example
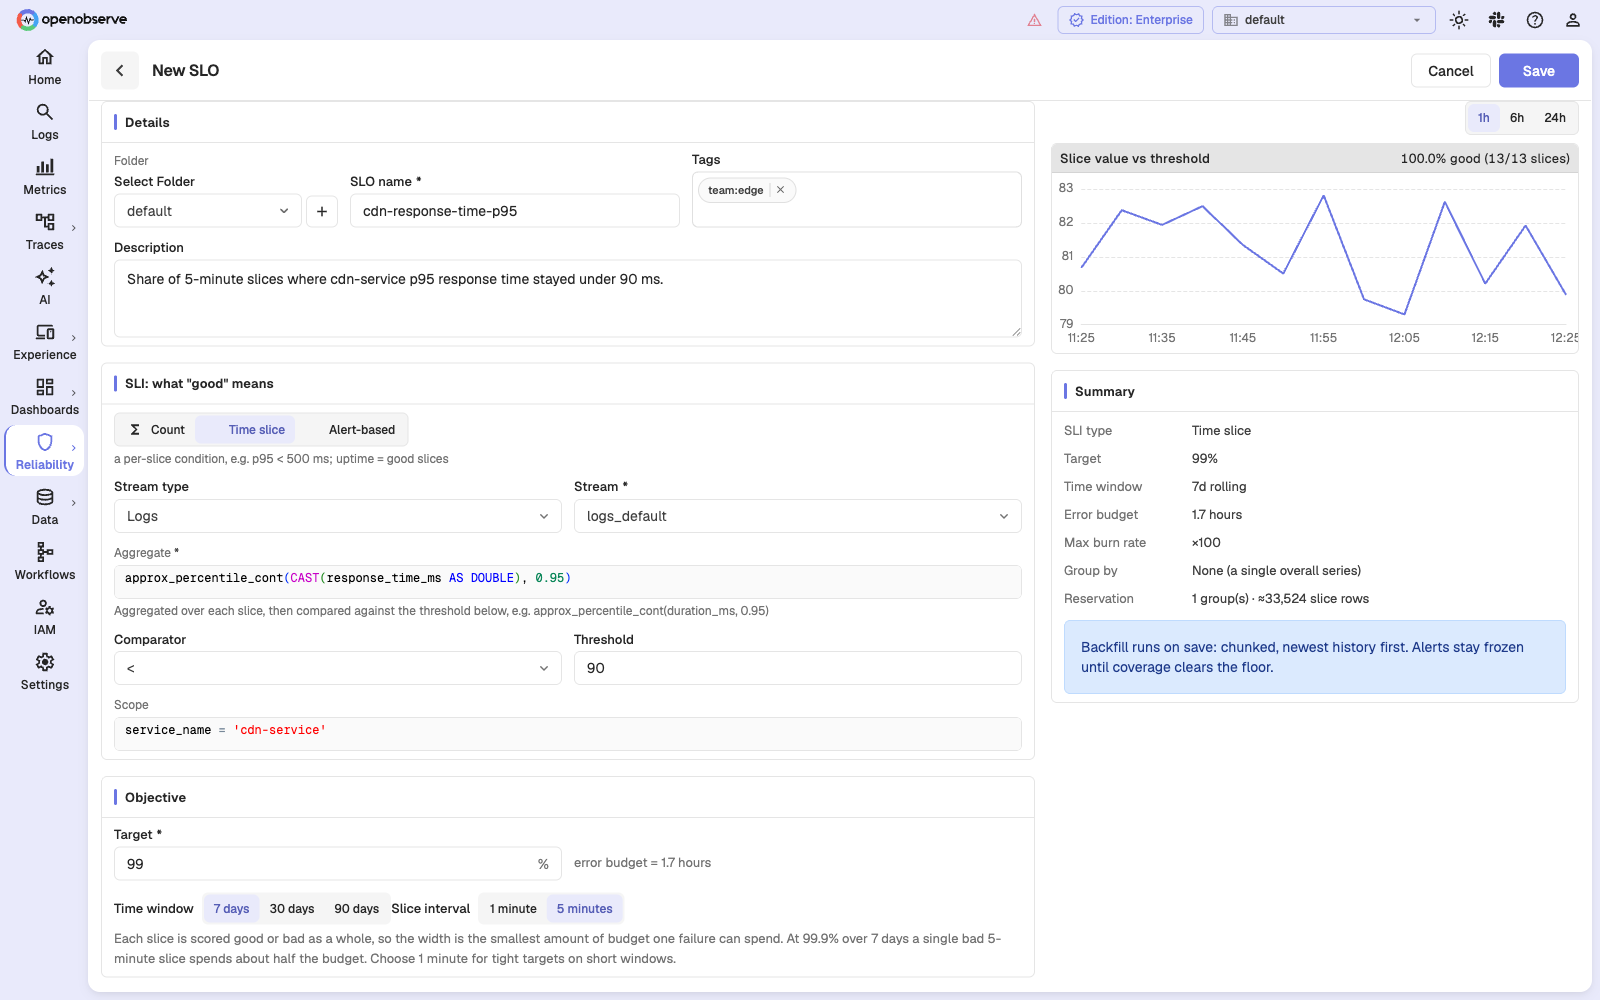
Goal: the CDN should keep p95 response time under 90 ms in at least 99% of five-minute periods over a rolling 7 days.
| Setting | Value |
|---|---|
| SLI type | Time slice |
| Stream | logs_default (logs) |
| Aggregate | approx_percentile_cont(CAST(response_time_ms AS DOUBLE), 0.95) |
| Comparator | < |
| Threshold | 90 |
| Scope | service_name = 'cdn-service' |
| Target | 99% |
| Time window | 7 days |
| Slice interval | 5 minutes |
A 7-day window at 5-minute slices holds 2,016 slices. A 99% target permits about 20 bad slices — roughly 1.7 hours — before the budget is gone.
The preview panel plots each slice's aggregate against the threshold line and reports how many slices were good, plus how many produced no data at all.
PromQL worked example
Goal: p95 request latency should stay below 300 ms in at least 99% of five-minute periods over a rolling 7 days.
| Setting | Value |
|---|---|
| SLI type | Time slice |
| Stream | http_request_duration_seconds_bucket (metrics) |
| Query language | PromQL |
| PromQL expression | histogram_quantile(0.95, sum by (le) (rate(http_request_duration_seconds_bucket[5m]))) |
| Comparator | < |
| Threshold | 0.3 |
| Target | 99% |
| Time window | 7 days |
| Slice interval | 5 minutes |
The expression returns seconds, so the 300 ms objective is entered as 0.3.
For an ungrouped SLO, the preview should show one series. If it reports several,
aggregate the extra labels away or add the intended labels under Group by.
For grouped SLOs, verify the label mapping in the Metrics query result because
the preview cannot detect group-label collisions.
The slice interval is load-bearing here
For a SQL count SLO the slice width is a storage decision. For a PromQL count it also controls the evaluation grid and range selectors. For a time-slice SLO it is part of the objective.
A whole slice is scored good or bad, so the slice width is the smallest amount of budget a single failure can spend. At a 99.9% target over 7 days the entire budget is about 10 minutes — so one bad 5-minute slice spends half of it, and two bad slices blow it completely.
Rule of thumb:
- Tight target on a short window (99.9% over 7 days) — use 1-minute slices, or the objective is unmeasurable in practice.
- Looser target, or a long window (99% over 30 days) — 5-minute slices are fine and cost a fifth of the storage.
Grouped SLOs are pinned to 5-minute slices, which is another reason to keep tight-target time-slice SLOs ungrouped.
Gaps versus failures
A slice that the query never measured — because the search failed, the SLO was paused, or the measurement job was down — is a gap. It lowers coverage and counts toward neither the numerator nor the denominator.
By default, a slice where the query succeeded but returned nothing is also treated as a gap. That is the right default for a latency SLO: no traffic means no latency to judge, not slow latency.
It is the wrong default for a freshness SLO, where silence is the failure.
For that case the API accepts an absent_is_bad flag on the time-slice
configuration, which makes a proved-empty slice score bad rather than
missing:
{
  "name": "ingest-pipeline-freshness",
  "sli_type": "time_slice",
  "config": {
    "stream": "logs_default",
    "stream_type": "logs",
    "query_language": "sql",
    "query": "count(*)",
    "scope": "service_name = 'stream-ingest-service'",
    "comparator": ">",
    "threshold": 0,
    "absent_is_bad": true
  },
  "window_secs": 604800,
  "slice_interval_secs": 300,
  "target": 99,
  "enabled": true
}
Notes on absent_is_bad:
- It is an API-only field; the SLO form does not expose it.
- It only changes the meaning of a successful query's empty result. A failed query still writes nothing, so a search outage still reduces coverage and freezes the SLO instead of manufacturing failures.
- It cannot be combined with grouping. A group absent from an entire pass cannot be gap-filled, so a grouped freshness SLO would freeze for exactly the failure it is meant to catch. The API rejects the combination.
For PromQL, remember the Prometheus lookback window: a bare gauge can continue
returning its last value for several minutes after it stops reporting. Use a
slice-wide range expression such as avg_over_time(metric[5m]) so a slice with
no samples returns no value. If absence must spend budget, create the SLO with
absent_is_bad: true through the API; without that flag, the empty slice is a
gap and lowers coverage instead.
Time slice or count?
Both can express "the service was 99.9% available", and they will disagree. The difference is what a burst of errors costs you.
Suppose one five-minute slice sees 10,000 requests and 500 of them fail, and the rest of the week is clean.
- A count SLO over 7 days with roughly 20 million requests records a 0.0025% error rate. Barely a scratch.
- A time-slice SLO records one bad slice out of 2,016 — 0.05% of the window — which at a 99.9% target is half the budget.
Neither is wrong. They answer different questions:
| Ask | Use |
|---|---|
| What fraction of requests failed? | Count |
| What fraction of time was the service degraded? | Time slice |
High-traffic user-facing services usually want the count form, because it weighs failures by how many people saw them. Infrastructure with steady, low, or bursty volume usually wants the time-slice form, because a count SLO there is dominated by whichever hour happened to be busy.
Next steps
Last updated on
Count SLOs
Create count SLOs in OpenObserve from SQL event predicates or PromQL counter expressions, and measure availability and success-rate objectives.
Alert-Based SLOs
Turn an existing scheduled alert into an SLO in OpenObserve: measure the fraction of time the alert was not firing, with proof-of-evaluation coverage.